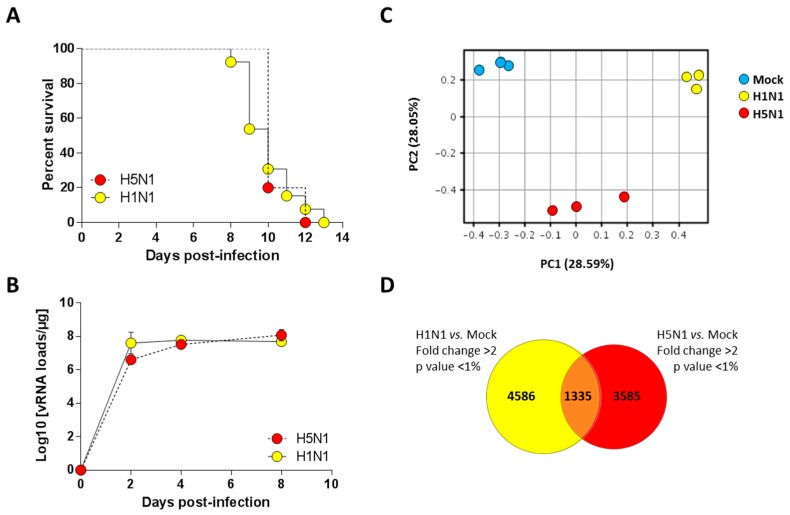
Figure 1.
Survival curves and viral loads of infected mice. (A) Lethalities of H5N1 and H1N1 were compared in mice infected with 1.4 × 10² PFU and 1.5 × 10⁵ PFU of H5N1 (n = 10) or H1N1 (n = 13), respectively; (B) Viral load in the lungs of H5- and H1-infected mice were measured using quantitative RT-PCR and expressed as copy numbers per µg of total lung RNA. Results are the mean ± SD obtained from six mice; (C) Principal component analysis of the lung genes normalized expression values. X-axis represents the first dimension (Component 1, 28.59% of the variance) which separates the mock conditions from the infected conditions, the y-axis represents the second dimension (Component 2, 28.05% of the variance) which separates the viral infections (i.e., H1N1 vs. H5N1); (D) Venn diagram depicting the differentially expressed genes (≥2.0-fold change, p-value < 0.05) common or unique to H1N1- and H5N1-infected mice relative to mock-infected mice.

