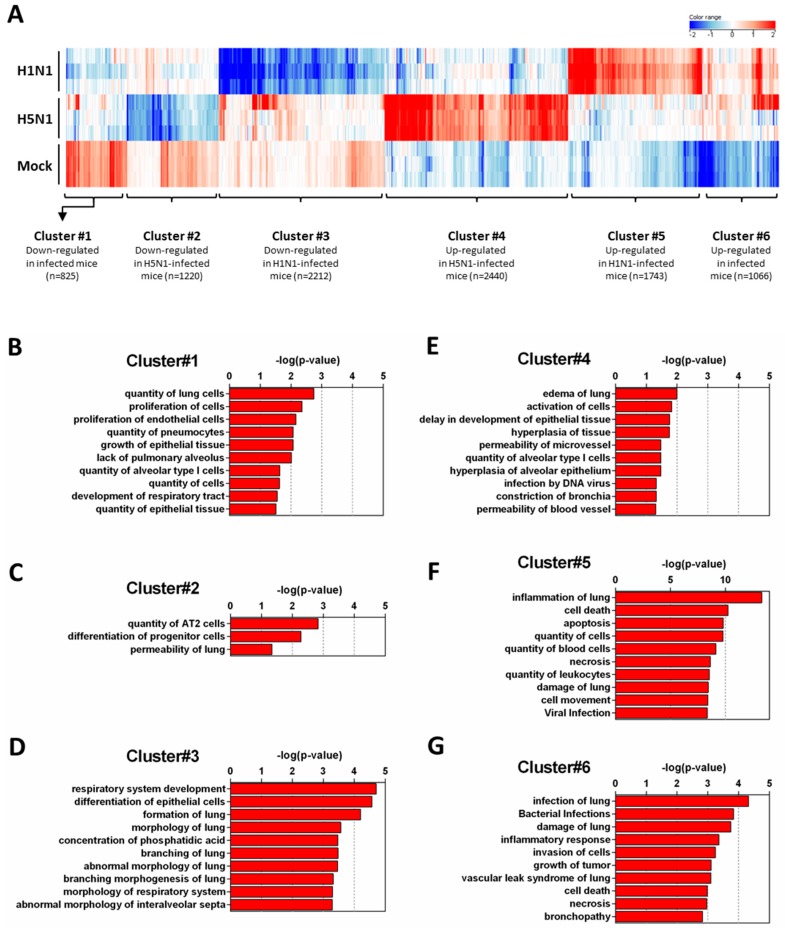
Figure 2.
Functional relationships of pathways regulated during infection. Total RNA from mock-, H1N1-, or H5N1-infected C57Bl/6 mice were extracted from lungs at day 4 pi and used to hybridize Agilent’s Whole Mouse Genome Microarray (4 × 44K; G4122F). GeneSpring software (Version 13.0; Agilent Technologies) was used to analyze differences of gene expression between mock-infected mice and H1N1- or H5N1-infected mice. (A) Hierarchical clustering diagrams showing individual replicates are represented. The magnitude of the expression is illustrated by the intensity of the color. Red and blue indicate higher and lower expression level, respectively; (B–G) Molecular and cellular functions associated with differentially expressed genes were compared using IPA. Each cluster was separately analyzed and annotations were ranked using the p-value obtained using the right-tailed Fisher’s exact test, it represents the probability of each biological function to be involved in the group of analyzed genes.

