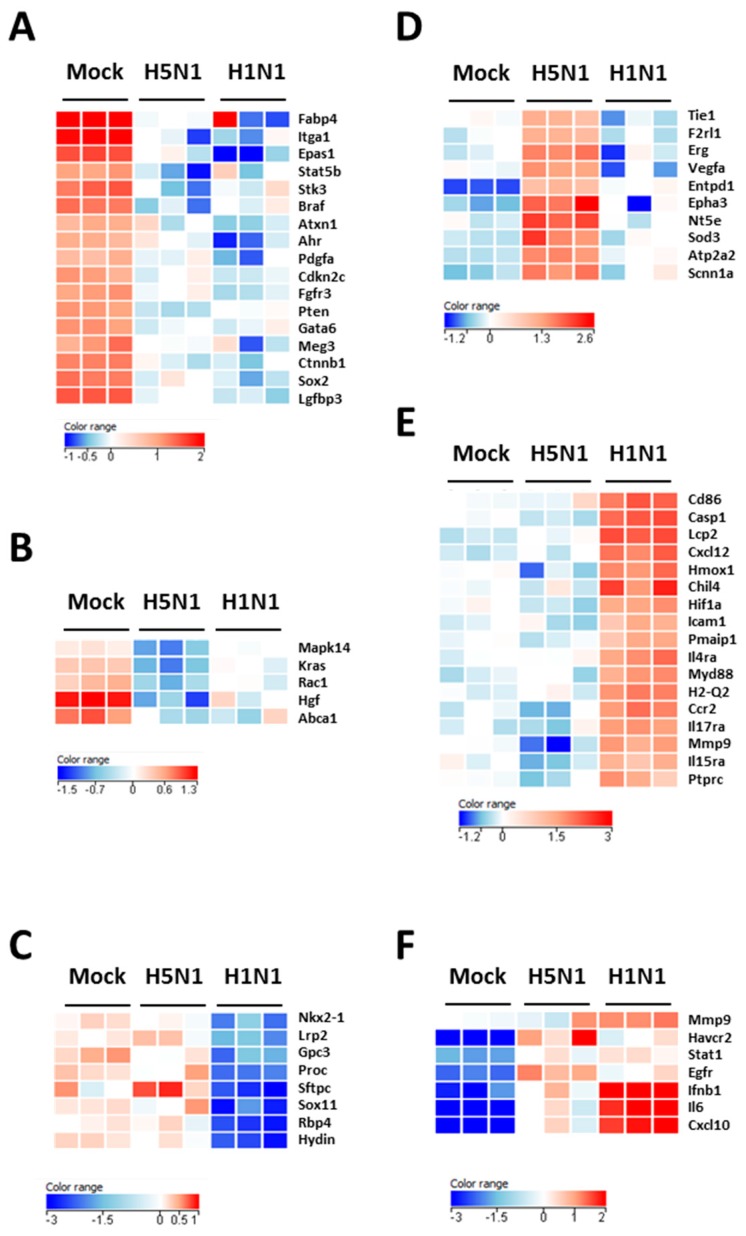
Figure 3.
Heat maps of selected genes in the lungs of mock- H1N1- and H5N1-infected mice at day 4 pi. Representative genes of each cluster were selected and represented as a heat map. Genes shown in red are upregulated and genes in blue are downregulated. The magnitude of the regulation is illustrated by the intensity of the color. (A) Heat map of genes from cluster 1 and related to growth of epithelial tissue; (B) Heat map of genes from cluster 2 and related to quantity of AT2 cells; (C) Heat map of genes from cluster 3 and related to respiratory system development; (D) Heat map of genes from cluster 4 and related to edema of lung; (E) Heat map of genes from cluster 5 and related to inflammation of lung; (F) Heat map of genes from cluster 6 and related to infection of lung.

