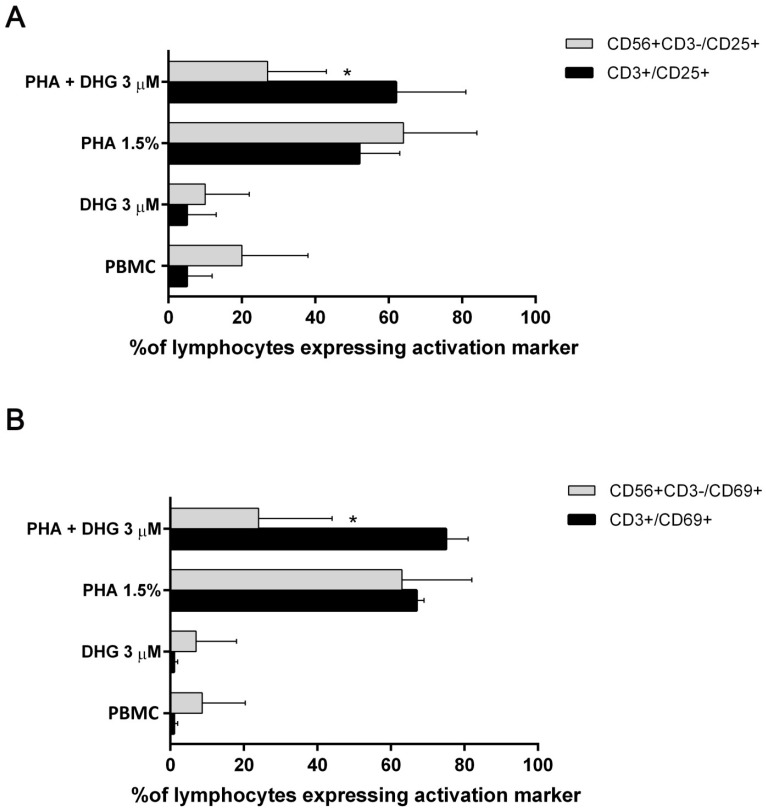
Figure 4.
Flow cytometric analysis of CD25 and CD69 surface expression on DHG-treated PBMC. PBMC from healthy donors (n = 7) were stimulated with PHA (1.5%) in the presence and in the absence of DHG. Unstimulated cells are included as control (PBMC) in the figure. Following 24 h of activation, CD3+/CD56− (black bars) and CD3−/CD56+ (gray bars) populations were analyzed for CD25+ expression (A) and CD69+ expression (B) and compared by ANOVA (* p < 0.05, compared with untreated PHA-activated cells). Bar graphs report mean values ± SD.

