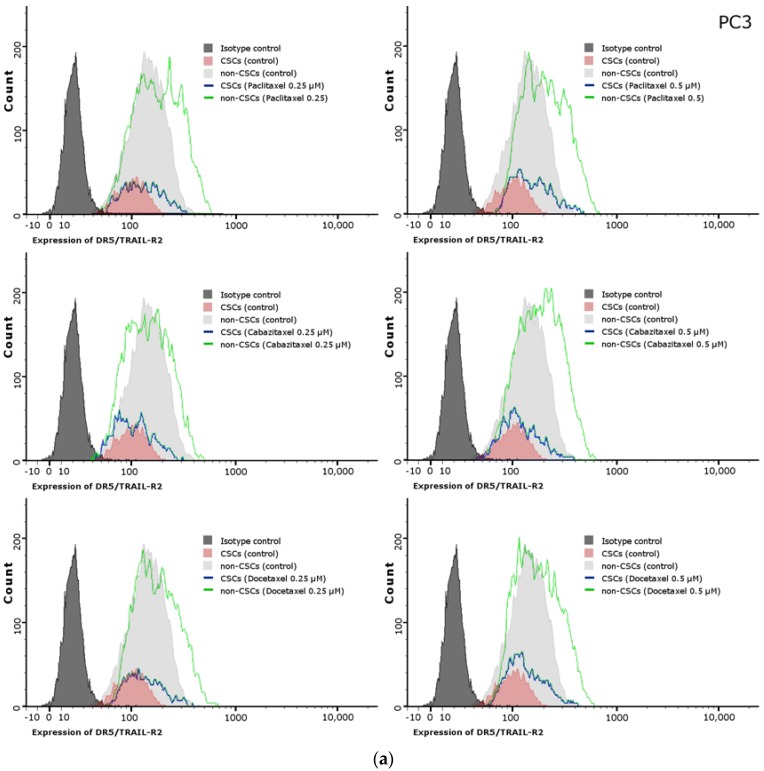
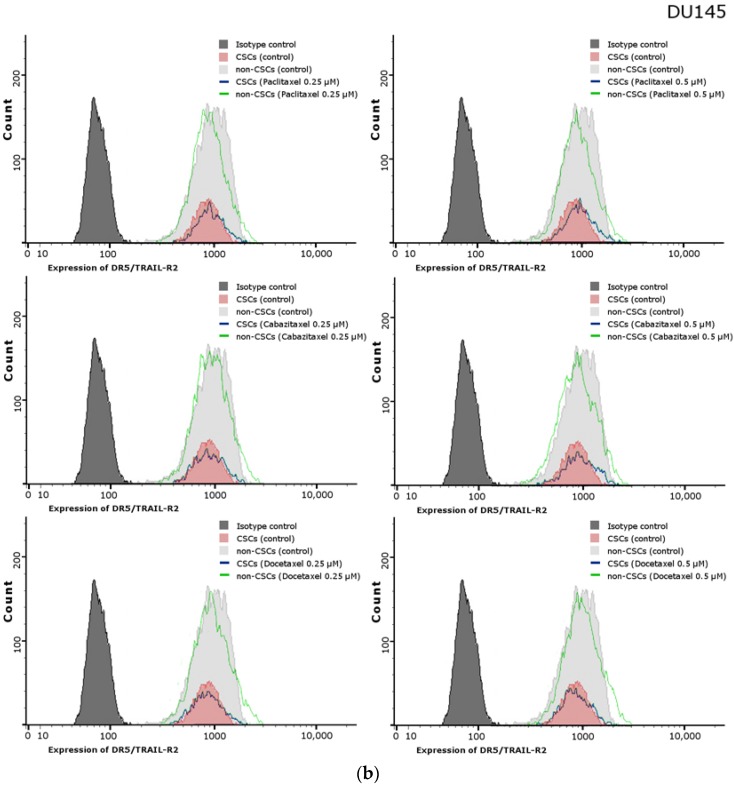
Figure 8.
Effects of paclitaxel, cabazitaxel or docetaxel on expression of TRAIL-R2 on the surface of CSCs and non-CSCs subpopulations within: PC3 (a); and DU145 (b) prostate cancer cells. The dark grey histogram shows isotype control, red corresponds to CSCs, light grey histogram shows non-CSCs, blue line shows CSCs after treatment with adequate taxane, and green line corresponds non-CSCs treated with adequate taxane.


