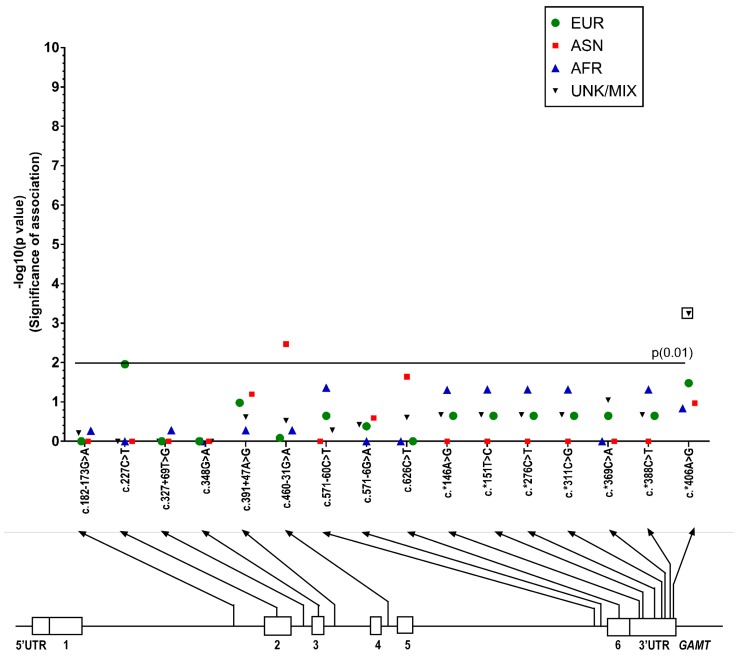
Figure 5.
Manhattan plot showing the p-values from Fisher’s exact test (significance of association, plotted as -log (p)) for each SNP sequenced on the guanidinoacetate methyltransferase (GAMT) gene. p-values are shown for European, East Asian, African, and Unknown/Admixed populations. The nominal statistical threshold for p = 0.01 is shown, and p-values that are still significant after running the Benjamin–Hochburg procedure are indicated with boxes. The location of each SNP is shown on the GAMT gene below the x-axis. EUR: European; ASN: East Asian; AFR: African; UNK/MIX: Unknown/Admixed populations.

