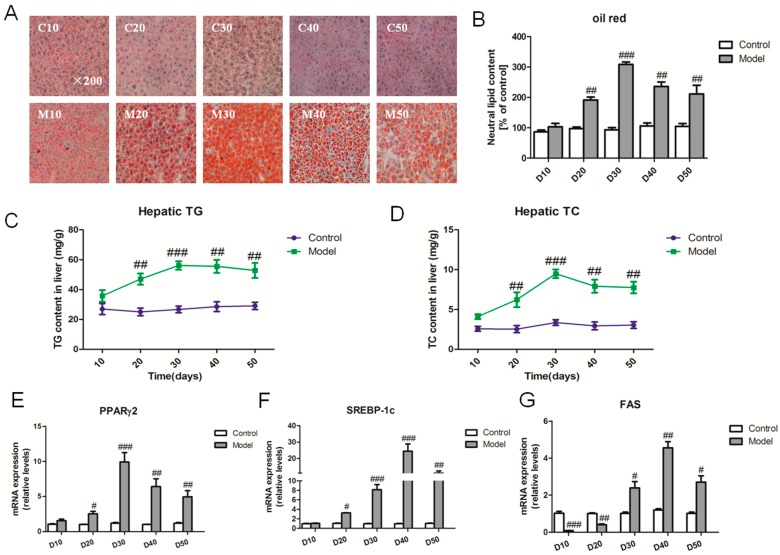
Figure 2.
High fat-sucrose diet induced fat overload in liver. The hepatic lipid metabolism of SD rats induced by a high fat-sucrose diet on day 10, 20, 30, 40, 50. (A) Oil red O staining (small red circles) shows neutral lipid deposition in the liver (original magnification 200×). Small red circles indicate the formation of large cytoplasmic lipid droplets; (B) Semi-quantitative analysis of the contents of lipid droplets; (C) Hepatic TG content; (D) Hepatic TC content; the relative lipid synthesis gene PPARγ2 (E), SREBP-1c (F), FAS (G) mRNA expression. The values are shown as the means ± SEM (n = 6). Compared with the corresponding control group, # p < 0.05, ## p < 0.01, ### p < 0.001.

