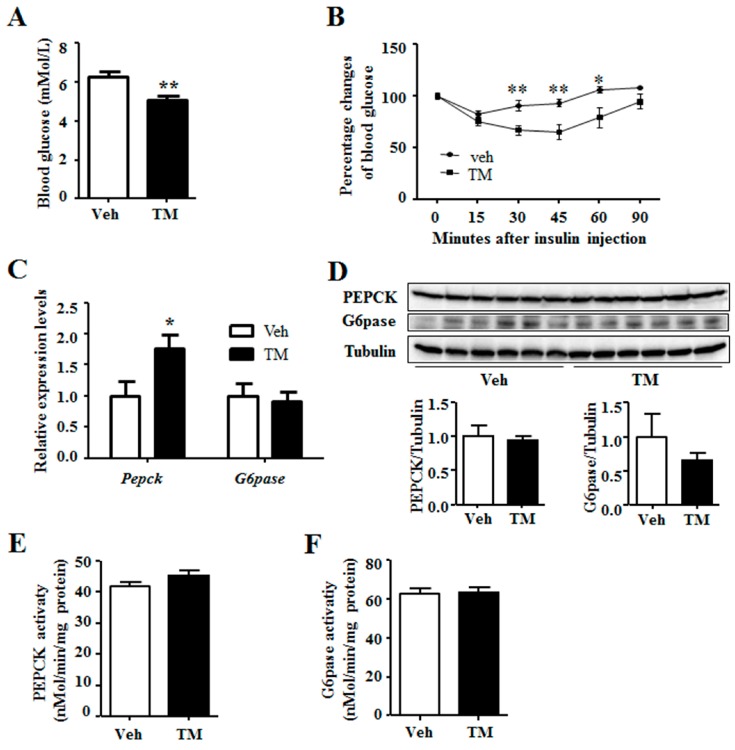
Figure 2.
Tunicamycin reduced blood glucose level. (A) Blood glucose levels under fed state; N = 6 per group; (B) Insulin tolerance test. N = 7 per group; (C) Expression of gluconeogenic genes. N = 6 per group; (D) Western blotting bands and quantification for liver proteins; (E) The enzyme activity of PEPCK; (F) The enzyme activity of G6pase. Veh, vehcle; TM, tunicamycin. * p < 0.05, ** p < 0.01 TM vs. Veh.

