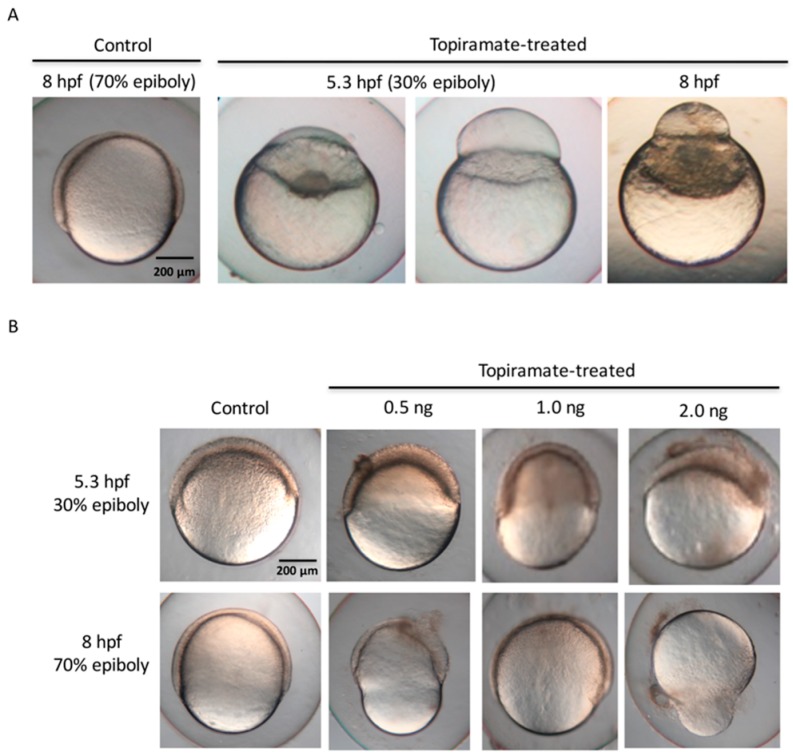
Figure 2.
Embryonic epiboly deficiency in topiramate-treated offspring. (A) Embryonic development observation from control and topiramate-treated offspring. Morphology at 8 hpf in the control group showed normal epiboly progression. Embryos from topiramate-treated female fish were abnormally expressed during epiboly progression from 5.3 hpf; (B) embryonic development observation from control and topiramate-injected embryos at 5.3 and 8 hpf. Scale bar: 200 μm.

