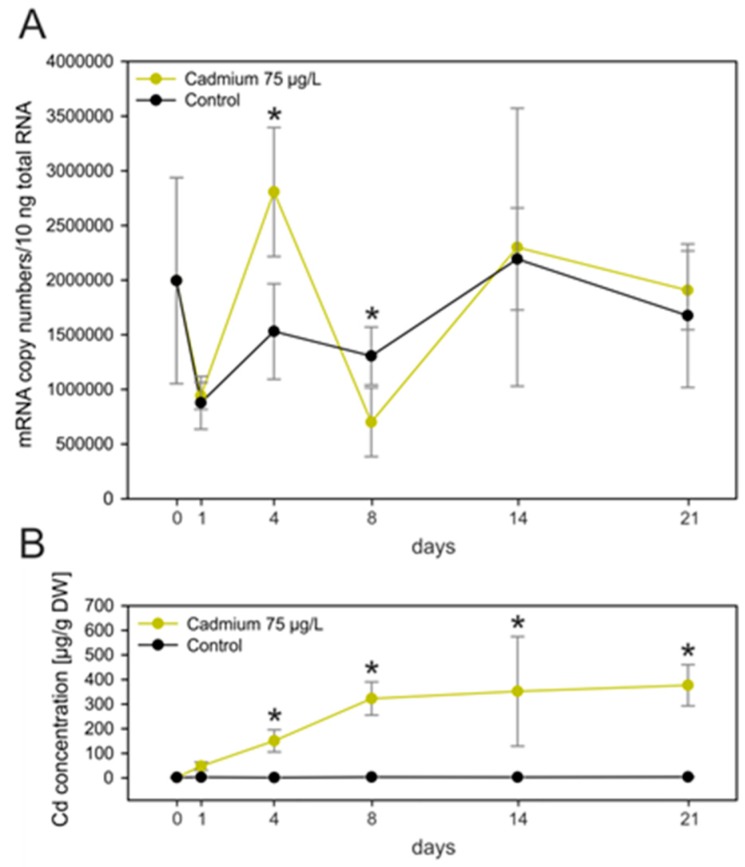
Figure 5.
(A) MT induction pattern in the midgut gland of untreated individuals (black line) and individuals exposed to cadmium (75 µg/L) (yellow line) of Biomphalaria glabrata over a period of 21 days. Means and standard deviations are shown (n = 4). The course of MT mRNA transcription was tested by two-way analysis of variance (ANOVA) (p ≤ 0.05) but was insignificant. Stars indicate significant differences at single time points according to multiple t-test comparisons; (B) cadmium concentration in the midgut gland of Biomphalaria glabrata from controls (black line) and exposed individuals (75 µg/L Cd) (yellow line). Means and standard deviations are shown (n = 4). Two-way ANOVA (p ≤ 0.05) revealed significant differences between the two treatments. Stars indicate significant differences at single time points according to multiple t-test comparisons.

