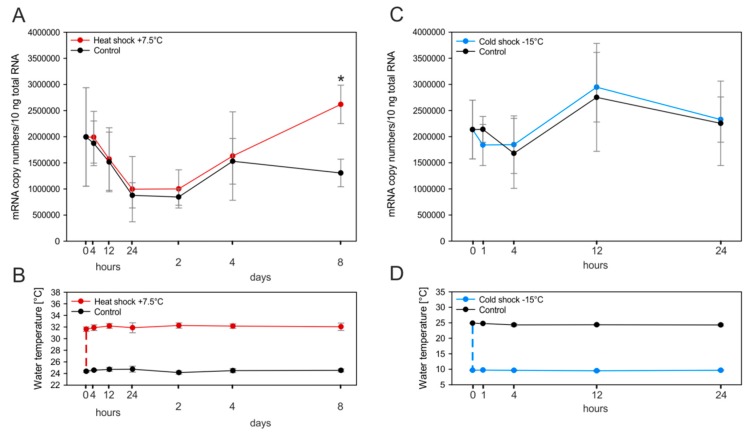
Figure 6.
(A) MT induction and pattern in the midgut gland of Biomphalaria glabrata in untreated individuals (black line) and snails exposed to a sudden temperature increase (+7.5 °C) (red line), persisting through a period of 8 days. Means and standard deviations are shown (n = 4). The course of MT mRNA transcription levels was tested by two-way ANOVA (p ≤ 0.05) but was insignificant. The star indicates a significant difference at a single time point according to multiple t-test comparisons; (B) water temperature profile for the duration of exposure. The dotted line indicates the heat shock at day 0; (C) MT induction pattern in the midgut gland of Biomphalaria glabrata in untreated individuals (black line) and animals exposed to a sudden temperature decrease (−15 °C) (blue line), through a period of 24 h. Means and standard deviations are shown (n = 4). The course of MT mRNA transcription levels was tested by two-way ANOVA (p ≤ 0.05) but was insignificant. (D) water temperature profile for the duration of exposure. The dotted line indicates the cold shock at day 0.

