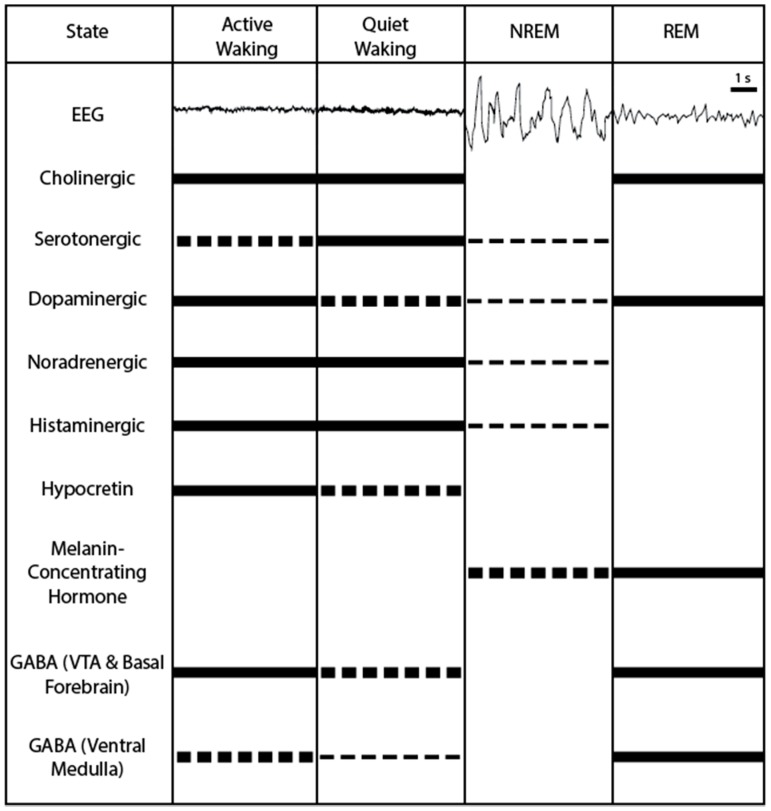
Figure 1.
A visual representation of neural activity profiles of sleep/wake-active neurons populations. Showing high (solid line), moderate (thick broken line), low (thin broken line), and quiet (no line) activity profiles during active waking, quiet waking, non-rapid eye movement sleep (NREM), and rapid eye movement sleep (REM) states in basal forebrain [25,26,27,28,29,30] and brainstem [31,32,33,34,35] cholinergic, dorsal raphe nuclei serotonergic [36,37,38], ventral tegmental area (VTA) dopaminergic [39,40], locus coeruleus noradrenergic [41,42,43,44], tuberomammillary nucleus histaminergic [45,46,47], lateral hypothalamic hypocretin [48,49,50,51,52,53,54,55,56], lateral hypothalamic area melanin-concentrating hormone [57,58,59,60], VTA and basal forebrain γ amino butyric acidergic (GABAergic) [26,61], and ventral medulla GABAergic neurons [62]. 1 s = 1 second.

