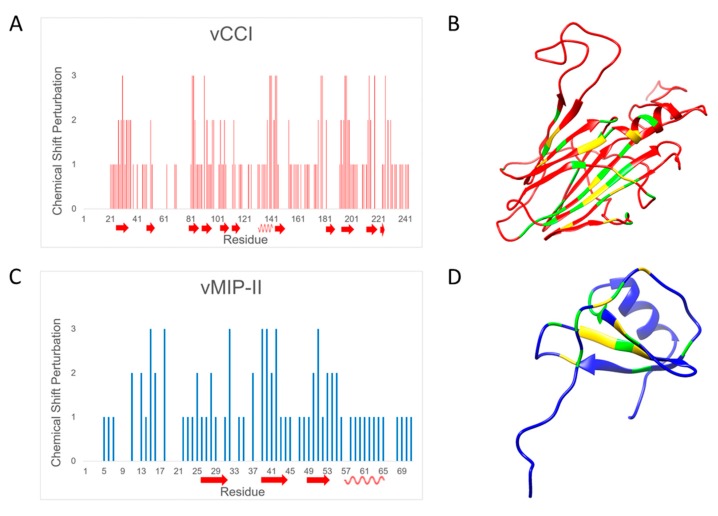
Figure 3.
Changes in chemical shift upon complex formation. (A) Changes in chemical shift in vCCI upon binding to vMIP-II. Arrows represent beta strands while spiral lines represent alpha helices. See Table 1 for definitions of “0”, “1”, “2”, “3”; (B) Structure showing changes in vCCI (Protein Data Bank code 2FFK upon binding vMIP-II. Green indicates greater than average, up to 1 standard deviation away from the average; yellow indicates over 1 standard deviation away from the average; red indicates below one standard deviation or the peak had not been discernable; (C) Changes in chemical shift in vMIP-II upon binding to vCCI. Secondary structure is shown by arrows and spiral lines, as in (A). See Table 1 for definitions of “0”, “1”, “2”, “3”; (D) Structure showing those changes in vMIP-II upon binding vCCI (Protein Data Bank code 1VMP). Green indicates greater than average, up to 1 standard deviation away from the average; yellow indicates over 1 standard deviation away from the average; blue indicates below one standard deviation or the peak had not been discernable. All structure figures were prepared by using UCSF Chimera (UCSF Resource for Biocomputing, Visualization, and Informatics, San Francisco, CA, USA) [28].

