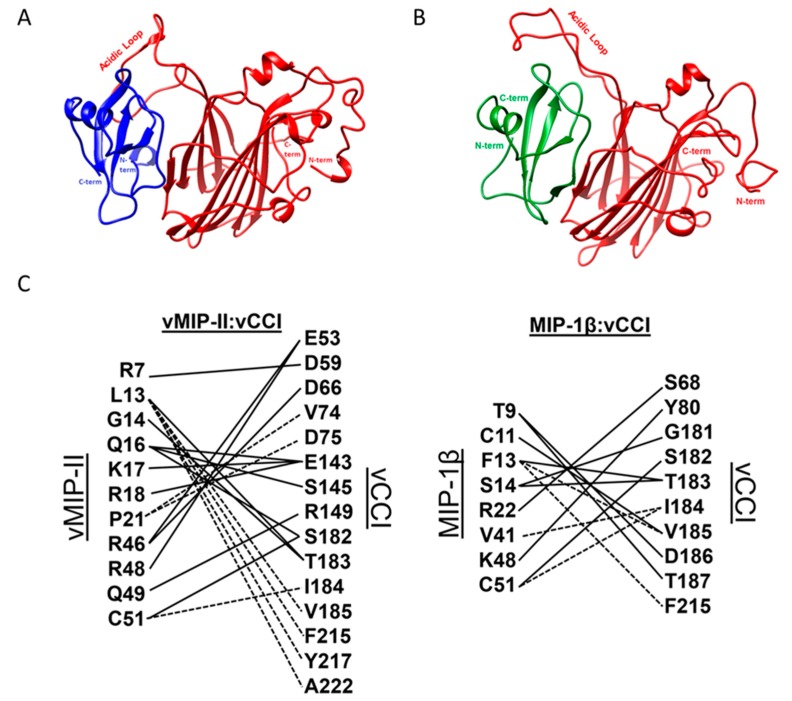
Figure 4.
Complexes after 1 μs molecular dynamics simulation of vCCI:chemokine. For all figures, vCCI is in red ribbon, and the bound chemokine is either blue ribbon (vMIP-II) or green ribbon (MIP-1β). (A) Structure of vCCI:vMIP-II after 1 μs trajectory; (B) Structure of vCCI:MIP-1β in complex after 1 μs trajectory; (C) Interactions between residues of vCCI and vMIP-II, as well as vCCI and MIP-1β. Hydrogen bonds (solid lines) are shown if they appear in at least 50% of the last 300 ns of the molecular dynamics simulation. Dashed lines indicate non-hydrogen-bond interactions between residues. These are defined as residues whose access to solvent is occluded upon complex formation at least 50% of the time, and that are within 2.8 Å of the partner residue on the other protein in at least 50% of the structures sampled every 20 ns for the final 500 ns of the trajectory.

