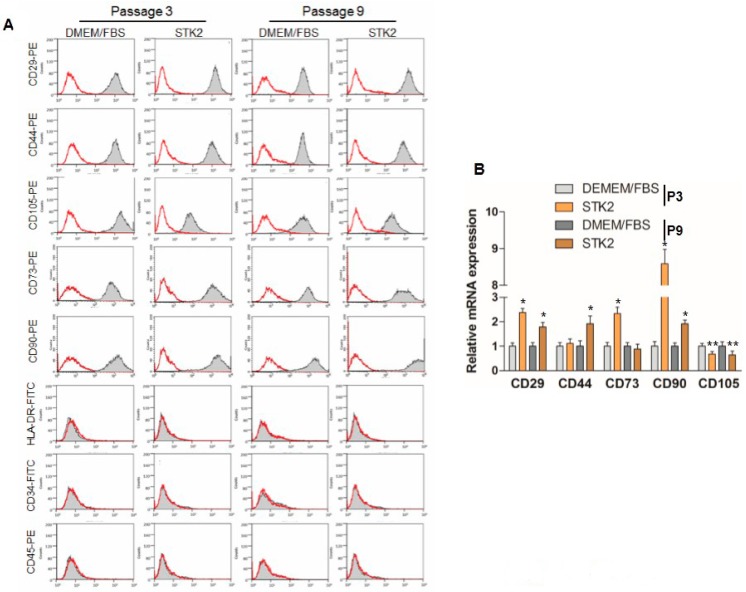
Figure 2.
Analysis of ASC marker expression. (A) ASCs were cultured in DMEM/FBS or STK2, and stained with anti-CD29-PE, anti-CD44-PE, anti-CD73-PE, anti-CD90-PE, and anti-CD105-PE antibodies as positive markers, and anti-HLA-DR-FITC, -CD34-FITC, and -CD45-PE antibodies as negative markers. A representative image from three independent experiments is shown; (B) Total RNAs were isolated and qRT-PCR was performed to analyze the expression of CD markers as described in the Methods section. Data represent the mean ± SEM as an average of three independent experiments. * and ** vs. corresponding passage DMEM/FBS. * p < 0.01; ** p < 0.05.

