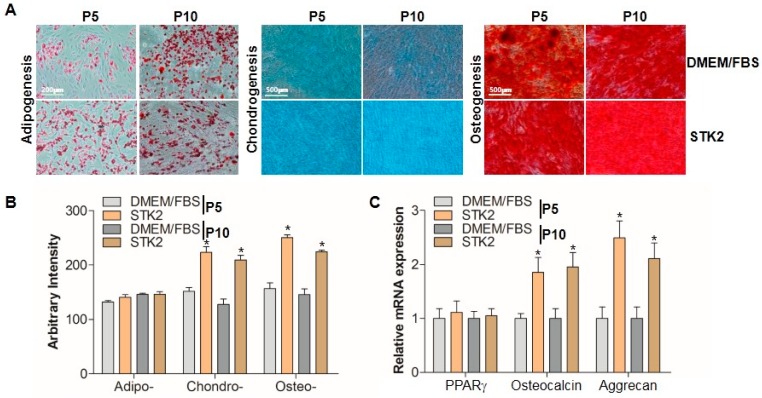
Figure 3.
Comparison of trilineage differentiation capability of ASCs cultured in DMEM/FBS and STK2. (A) Differentiation into adipocytes, chondrocytes, and osteocytes was induced and stained as described in the Methods section. A representative image from three independent experiments is shown; (B) The staining intensity was quantitated and evaluated by ImageJ, and expressed as arbitrary intensity; (C) The mRNA expression levels of PPARγ (adipogenic marker), osteocalcin (osteogenic marker), and aggrecan (chondrogenic marker) were quantitated using qRT-PCR and presented as relative expression (n = 3). Data represent the mean ± SEM as an average of three independent experiments. * vs. corresponding passage DMEM/FBS. * p < 0.05.

