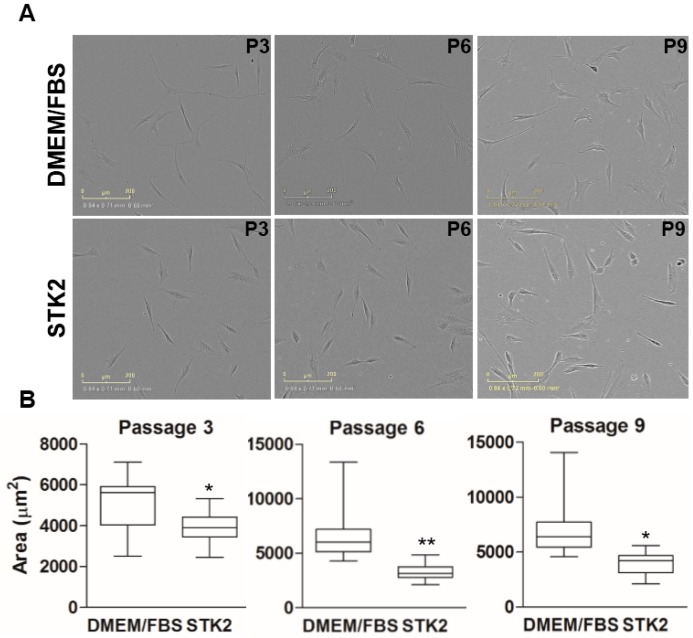
Figure 5.
Comparison of cell size of ASCs cultured in DMEM/FBS and STK2. (A) Images were captured at the indicated passage using an IncuCyte ZOOM Live-Cell Analysis System at 100× magnification; (B) Adherent cell size was measured by analyzing phase-contrast images with ImageJ. Analyzed adherent cell sizes were compared by box-and-whisker plot. Data are represented as the mean ± SD of the average of at least three independent experiments. * and ** vs. DMEM/FBS. * p < 0.001; ** p < 0.0001.

