Figure 6.
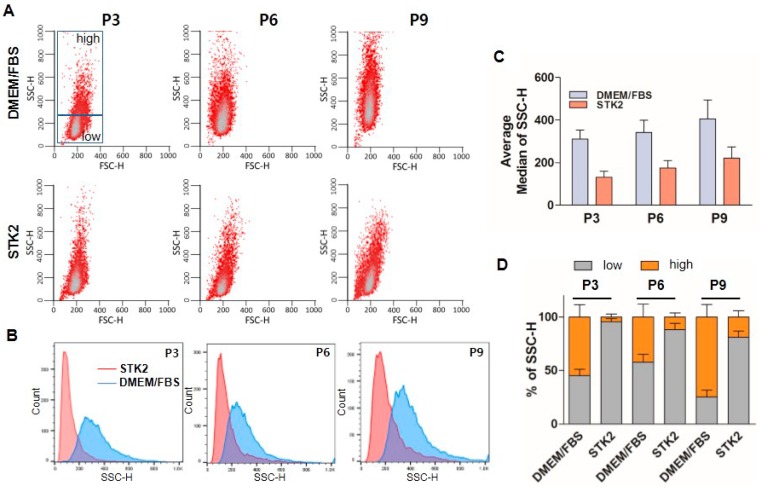
FACS analysis of ASCs cultured in DMEM/FBS and STK2. (A) Cellular homogeneity of ASCs was analyzed by FACS; (B) SSC-H distribution; and (C) average median values of SSC-H were compared using each indicated passage of ASCs cultured in DMEM/FBS and STK2; (D) Values over 300 in SSC-H were grouped as the high SSC (HSSC) population and values below 300 in SSC-H were grouped as the low SSC (LSSC) population. The change of each population is presented as a bar graph (n = 3).

