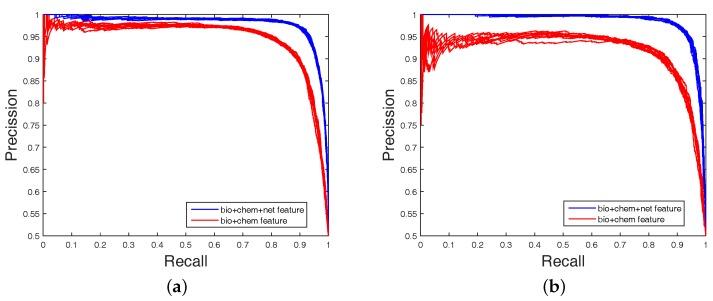
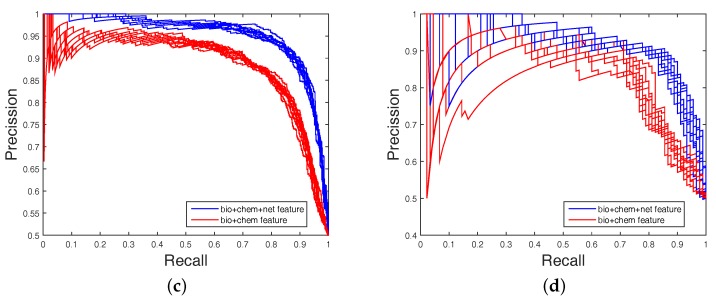
Figure 2.
The area under the precision–recall (PR) curve (AUPR) values obtained on balanced datasets (with FS). The blue curve is the combined feature of MACCS (chem), DWT (bio), and net. The red curve is the combined feature of MACCS (chem) and DWT (bio); (a) Enzyme’s PR curve with network feature; (b) IC’s PR curve with network feature; (c) GPCR’s PR curve with network feature; (d) Nuclear receptor’s PR curve with network feature.


