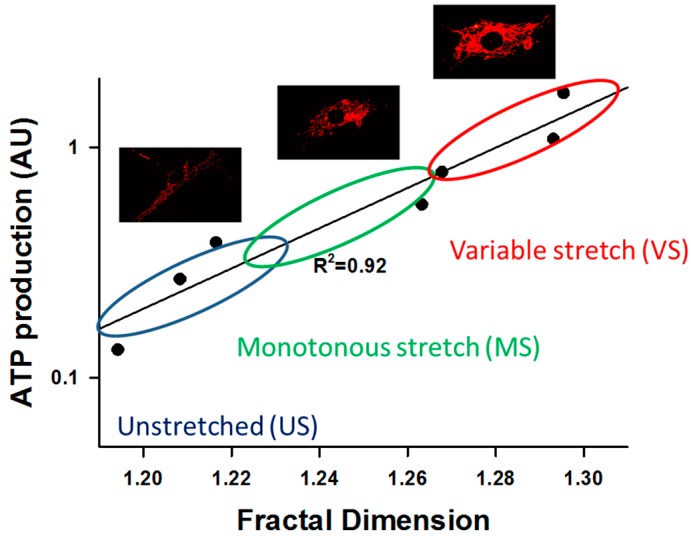
Figure 4.
Relationship between complexity, measured by the fractal dimension Df, and function, assessed by a fluorescent dye (TMRM, see text) intensity that is related to ATP production rate in VSMCs. There is a linear relation between the log of ATP production and Df. The dots represent binned data from about 2000 cells showing unstretched control cells (US), 4 h of monotonously stretched (MS) cells (10% area strain at 1 Hz), and 4 h of stretching cells with a variable stretch (VS) pattern in which every cycle is different with the amplitudes uniformly distributed between 7.5% and 12.5% area strain. The US cells are in the lower left corner. These cells produce little energy and their mitochondrial fractal organization is the least complex. MS cells produce somewhat more energy and their Df is also higher, whereas VS cells produce the most ATP and have the highest complexity in terms of their fractal organization. The images show mitochondrial networks corresponding to US, MS, and VS cells. ATP production rate is related to the intensity of red color. The results were obtained by reanalyzing the data from [14].

