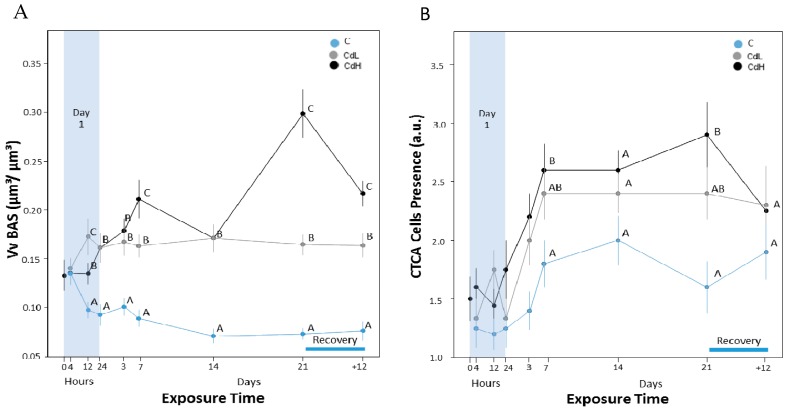
Figure 7.
(A) Time course of volume density of basophilic cells (VVBAS) in the midgut gland tubules of Littorina littorea. Means (symbols) and standard errors (bars) are shown. Different letter codes between single values of the same time point indicate statistically significant differences (p < 0.05); (B) Progression of the presence of connective tissue calcium cells (CTCA) in the midgut gland of periwinkles, expressed in arbitrary units (a.u.) (see Table 1 in the Materials and Methods section for explanation). Means (symbols) and standard errors (bars) are shown. Different letter codes between single values of the same time point indicate statistically significant differences (p < 0.05).

