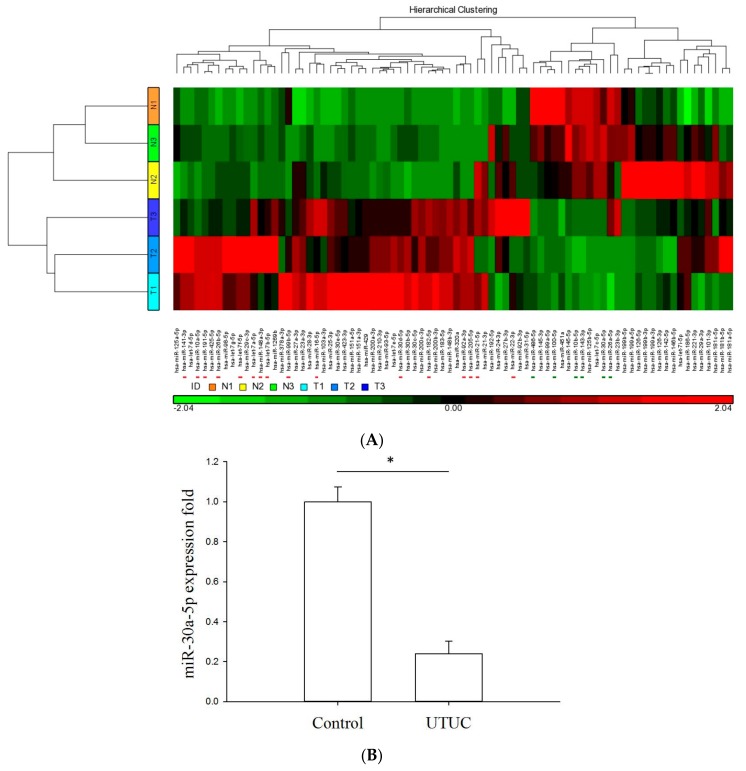
Figure 1.
Expression profiles of miRNAs in human UTUC tumor and non-tumor samples. Three tumor (T1–T3; light blue to navy blue) and three adjacent normal tissues (N1–N3; orange-yellow-green) were subjected to RNA extraction and NGS-miRNA sequencing through the Illumina MiSeq platform. (A) Heat-map clustering analysis was conducted to examine the overall miRNA expression profiles among samples. A line scatterplot was used to present miRNA expression profiles; (B) Downregulation of miR-30a-5p in UTUC tumor tissues (n = 22) compared with adjacent normal controls (n = 14) by RT-qPCR analysis. The asterisk denotes p < 0.001 using an unpaired t-test.

