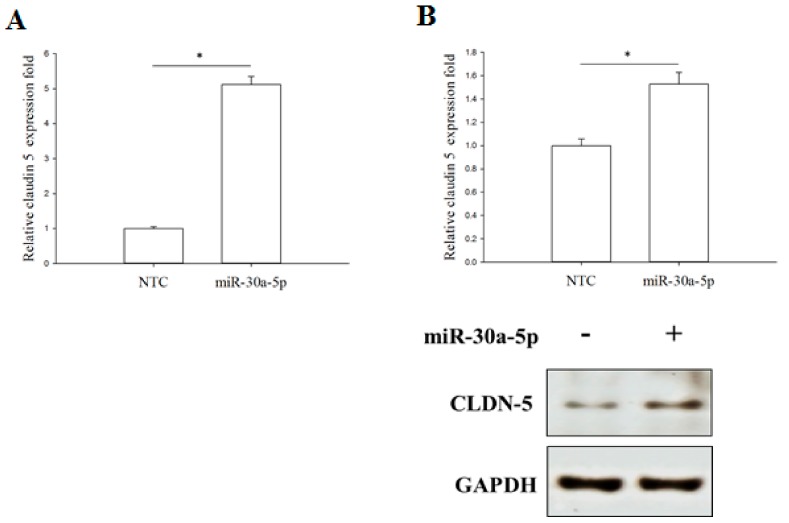
Figure 7.
Claudin-5 expression is enhanced by the miR-30a-5p. The qPCR (A) and Western blot (B) analysis of CLDN-5 expression levels in cultured BFTC-909 cells transfected with miR-30a-5p or miR-NC. GAPDH was used as the loading control. Data are expressed as means ± SEM (n = 3). * indicates that p < 0.05 between the indicated groups.

