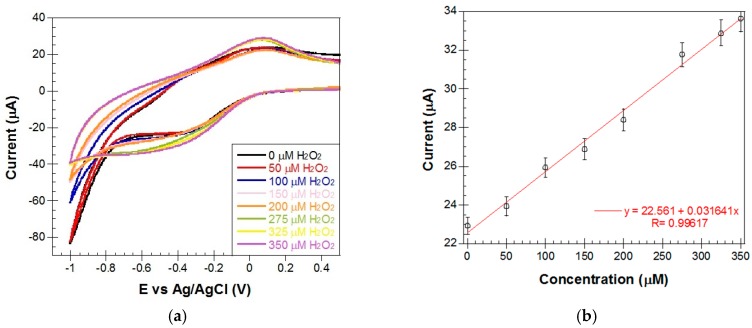
Figure 12.
(a) CVs obtained for a Metglas/ZnO/Hb electrode in PBS buffer before and after the addition of increasing amounts (50–350 μM) of H2O2 at a scan rate of 0.1 V/s (sensing signals measured 30 s after each addition of H2O2); and (b) a plot of peak current values vs. H2O2 concentration. Error bars were determined from repeating the measurements on the same electrode at least three times.

