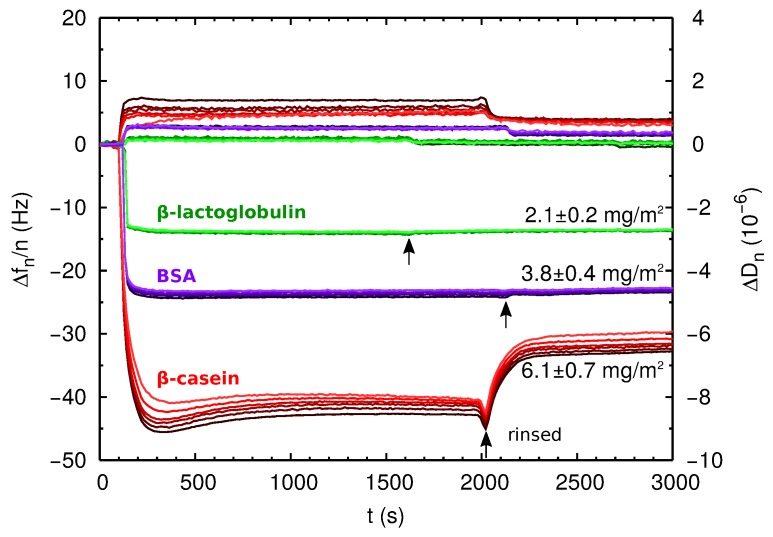
Figure 4.
QCM-D measurements for direct adsorption experiments of proteins onto negatively-charged PS hydrophobic surfaces. The curves labeled with the protein names correspond to the changes in resonance frequency of the QCM crystal as a function of time due to the addition of 1 mg/mL protein solution. We also show the energy dissipation measured during the same experiments (unlabeled curves). Black arrows indicate the time at which the crystal is rinsed with protein-free buffer solution. The overtones from to are represented in different tonalities from dark to pale. The adsorbed mass indicated in the figure is obtained using Equation (6) as explained in the main text.

