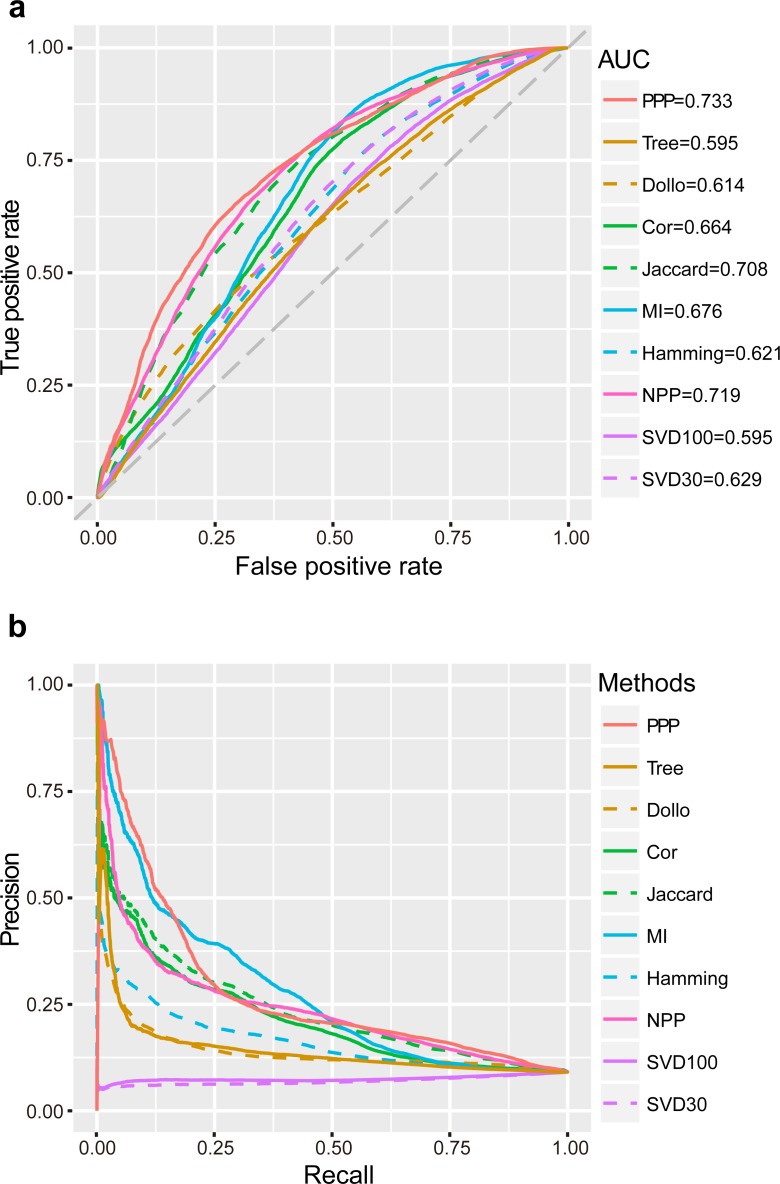
Figure 1. Performance of PPP.
ROC curves (A) and PR curves (B) of PPP compared with Jaccard similarity (“Jaccard”), Pearson correlation coefficient (“Cor”), mutual information (“MI”), Hamming distance (“Hamming”), maximum likelihood (“Tree”), Dollo parsimony distance (“Dollo”), NPP normalization (“NPP”), and SVD normalization using all (“SVD100”) or top 30% (“SVD30”) of the unitary matrix, on a dataset comprising 57,114 positive linkages and 571,140 random protein pairs. The gray diagonal dash line is the random guess line.

