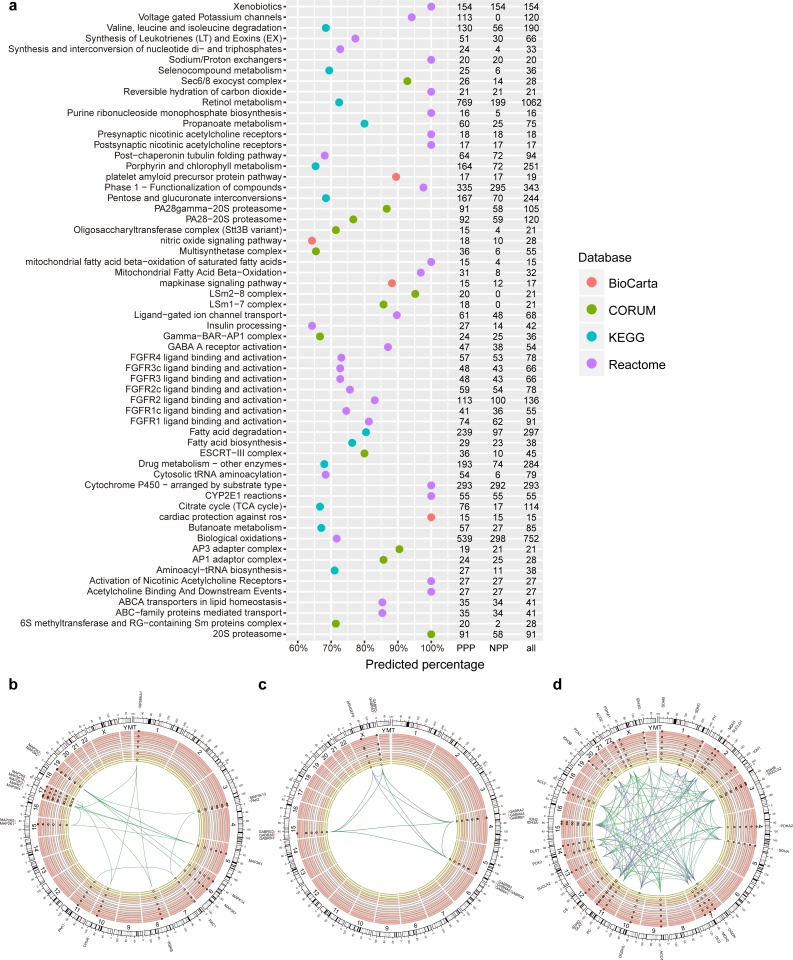
Figure 2. PPP predicted linkages in human pathways and complexes.
(A) Top pathways and complexes with high predicted percentage (>50% and the number of predicted links is at least 15) in BioCarta, KEGG, Reactome, and CORUM databases. The number of PPP predicted (threshold 400, sensitivity 0.97), NPP predicted (threshold 0.73, sensitivity 0.97), and original linkages is presented on the right. (B–D) Selected Circos visualization of predicted linkages in the MAPK signaling pathway (B), GABA A receptor activation (C), and TCA citrate cycle (D). The outer ring shows the ideogram of human karyotype plus the mitochondria genome. The next six rings, coloured with yellow to dark red, show the present percentage for each protein. From outer to inner rings, points in each ring indicate the percentage in three Kingdom-size groups in Eukaryota (Animals, Plants, Fungi, and Protists), Bacteria, and Archaea. In percentage rings, the vertical axis ranges from 0 to 1, and the axis direction is from inner to outer space. The dash central line indicates the 50th percentile. In the centre, arcs indicate correlated relationships between paired proteins. The green arcs represent successfully predicted links according to the corresponding database. The purple arcs indicate false negative links. Outside the ideogram, proteins are annotated with symbols, and marked at corresponding genomic positions.

