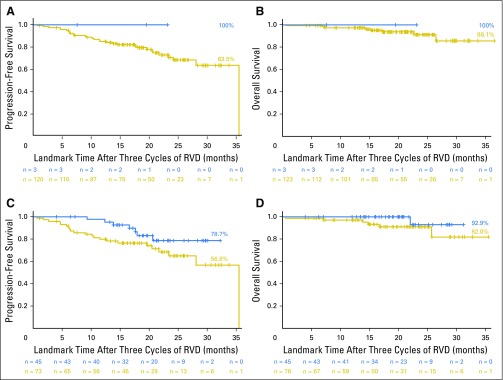
Fig 2.
Progression-free survival (PFS) and overall survival (OS) according to normalization of magnetic resonance imaging (MRI) and positron emission tomography-computed tomography (PET-CT) after three cycles of induction therapy. (A) PFS, MRI normalized versus positive (P = .42). (B) OS, MRI normalized versus positive (P = .67). (C) PFS, PET-CT normalized versus positive (P = .08). (D) OS, PET-CT normalized versus positive (P = .16).

