
Figure 1. Total abdominal irradiation impairs cognitive function in mouse models.
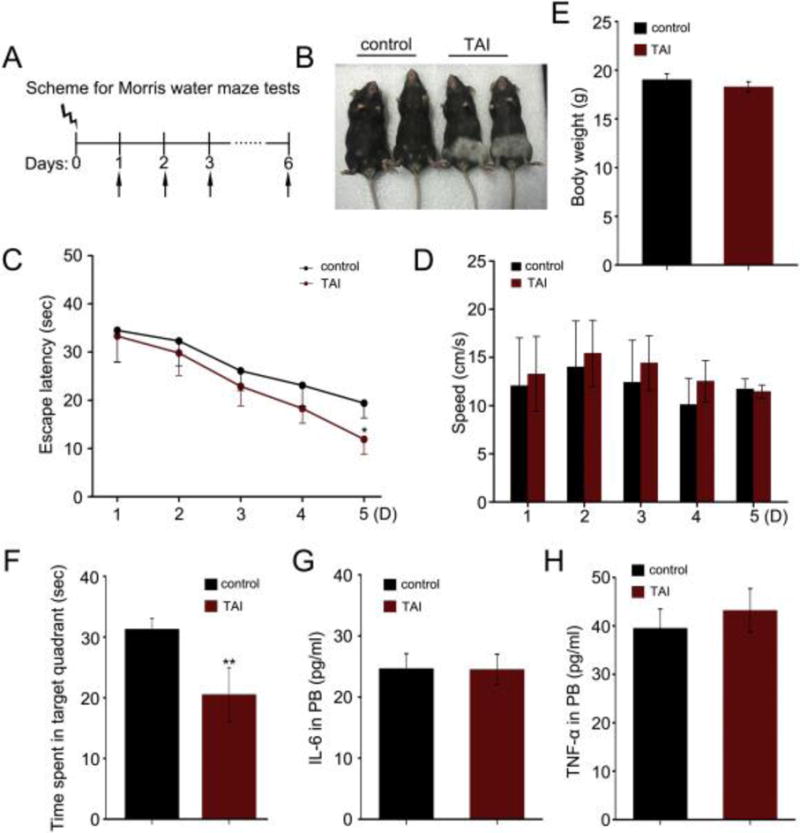
(A) Scheme for Morris water maze test. (B) The mice exposed to 10 Gy TAI (right) along with mice without irradiation (left). Note the change in fur color in the irradiated lower body. (C, D) The escape latency time to reach the hidden platform and swimming speed during the 5 days of Morris water maze test were shown. F (1, 71) = 4.381, *P < 0.05, ANOVA, n = 18. (E) The body weight of mice with or without TAI was measured. (F) The times spent in target quadrant and swimming traces in 60 s at day 6 of Morris water maze were shown. F (1, 17) = 9.072, **P < 0.01, ANOVA, n = 18. (G, H) The levels of IL-6 (G) and TNF-α (H) in peripheral blood were examined by ELISA. No significant difference; Student t-test, n = 18.