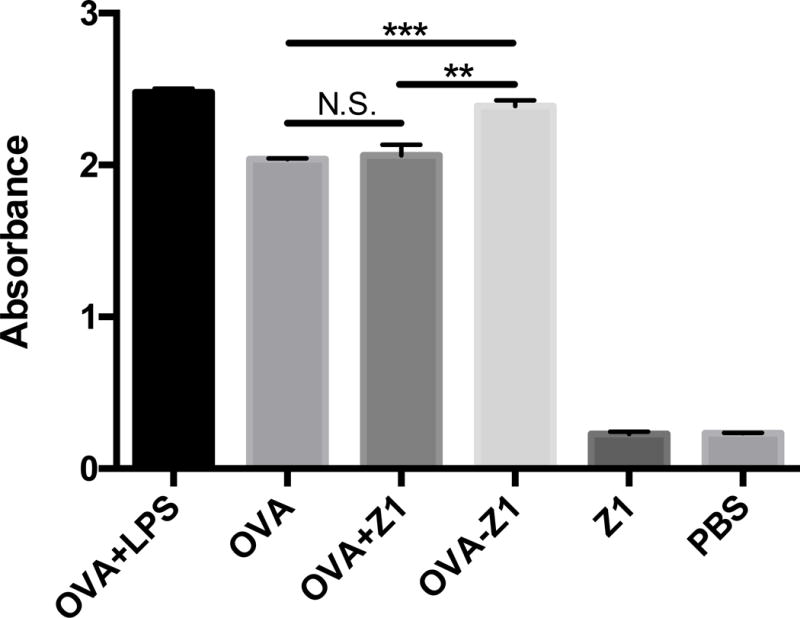
Figure 7.

Conjugation of OVA257–264 to Z1 nanofibers enhanced MHC class I antigen presentation. (a) B3Z T cell activation detected based on β-galactosidase activity with the absorbance at 570 nm. The equivalent OVA concentrations of each group were the same (50 μM). The concentration of Z1 control was also 50 μM. The LPS concentration was 1 μg/mL. (b) The epitope density along nanofibers significantly affected B3Z activation. The three groups of OVA–Z1+Z1 had the same concentration of OVA–Z1 (50 μM), but varied concentrations of Z1. For both panels, B3Z activation data were presented as mean ± SD (n=3). Statistical analysis was conducted with student’s T test (*p<0.05, **p<0.01, ***p<0.001).
