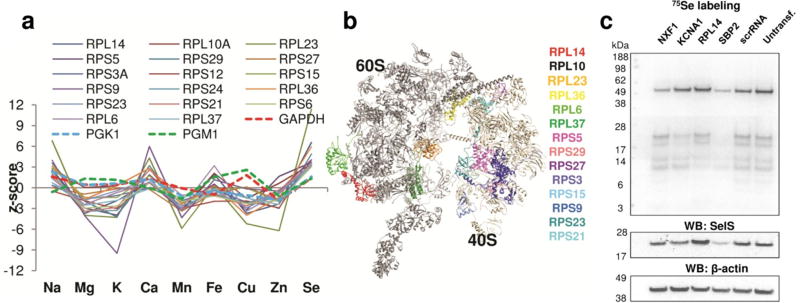
Figure 3. Characterization of genes that affect the selenium ionome.
(a) Ionomic profile data of the ribosomal functional cluster. Selenium z-scores (derived from three replicates) from the screen were analyzed by using DAVID. Glycolytic enzymes (GABDH, PGK1 and PGM1) are shown for comparison. (b) Model of eukaryotic (yeast) 80S ribosome with the location of identified ribosomal cluster genes. (c) Analysis of selenium candidates in HeLa cells by metabolic 75Se labeling. HeLa cells were transfected with the indicated siRNAs. 75Se was added to the cells 24 h prior to harvesting. Cell lysates were analyzed by SDS-PAGE followed by Western blotting with antibodies specific for SelS and β-actin. The 75Se-labeling pattern was visualized with a PhosphorImager.

