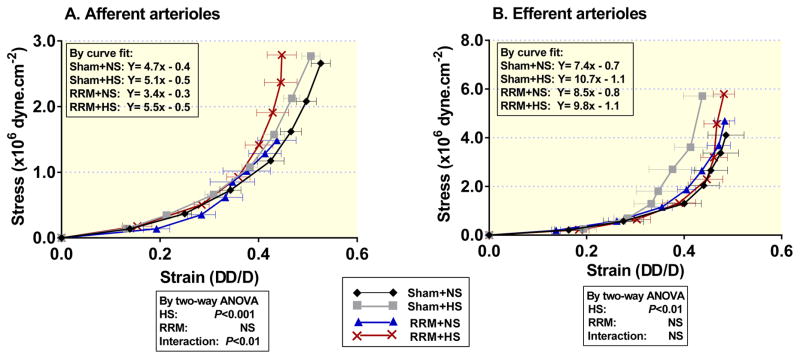
Figure 4.
Passive wall stress/strain relationships in afferent arterioles (Panel A) and efferent arterioles (Panel B) from shamed-operated mice with NS (black diamonds with black line) or HS (gray squares with gray line) or from RRM mice with NS (blue triangles with blue line) or HS (red crosses with red line). Values are presented as mean ± SEM (n=5 per group). Data were analysed by Curve fit to obtain the equation with the slop and Y intercept that was used to calculate the values of wall stress at wall strain (ΔD/D=0.45) for each group. The effects of HS and RRM on the wall stress and their interaction are analysed by two-way ANOVA. Six comparisons from 4 groups were performed by Bonferroni multiple comparisons test. Panel A (afferent arterioles), RRM with NS versus sham with NS: P<0.05, RRM with HS versus RRM with NS: P< 0.001. Panel B (efferent arterioles), sham with HS versus sham with NS: P<0.05.

