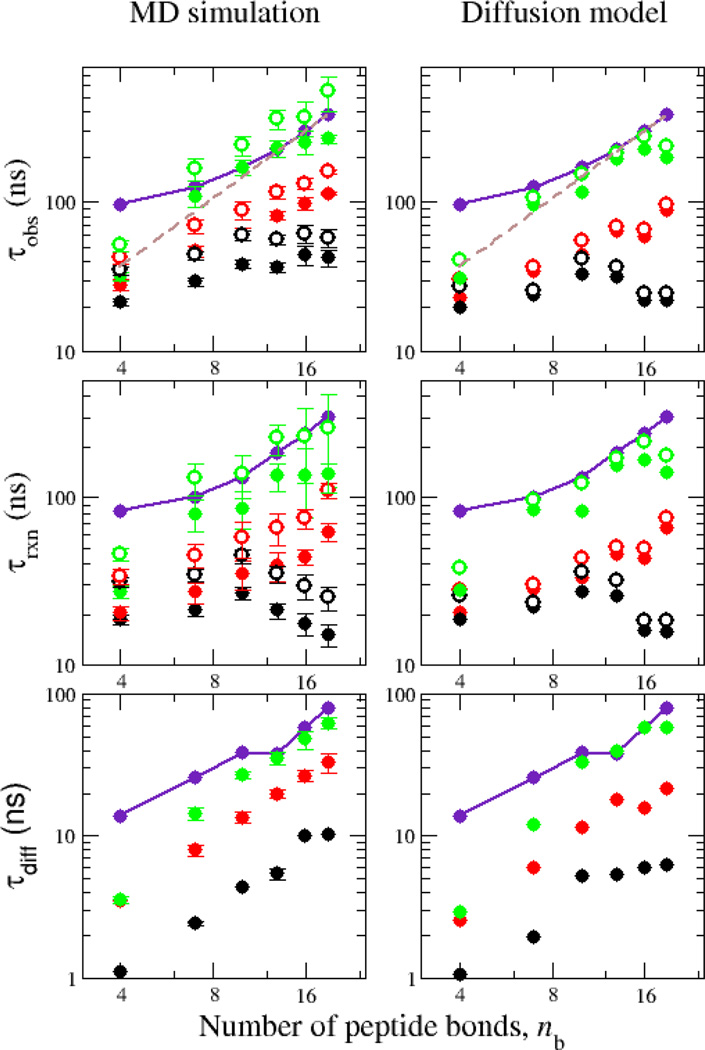
FIG. 2.
Dependence of quenching times (inverse of quenching rates) on chain length. Top, middle and bottom rows show the overall, reaction-limited and diffusion-limited quenching times, respectively. Simulation data for Amber ff03*, ff03w and ff03ws are shown by black, red and green symbols, respectively. Filled and empty symbols are for step-function and exponential distance dependence respectively. Experimental data are shown by purple symbols, and scaling expected for a Gaussian chain by the broken line. Left panels are rates calculated directly from simulation and right panels are those calculated from 1D diffusion model using SSS theory.

