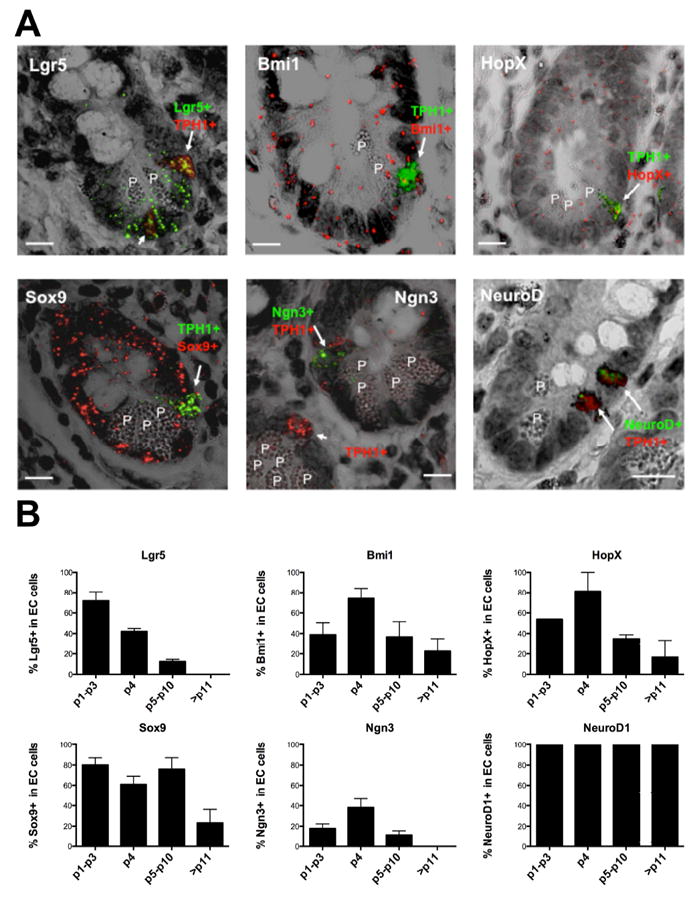
Figure 1.

Expression of ISC and differentiation genes in human ileal EC cells. (A) Representative images of RNA-ISH of FFPE sections from normal ileal mucosa merging fluorescent and transmitted light images to visualize EC cell location and indicated gene expression. (Top left) Lgr5+ EC cell with high TPH1 (arrow) at position 4 and Lgr5+ EC cell with low TPH1 (short arrow) at crypt base. (Top center) Bmi1+/TPH1+ EC cell (arrow) at position 4. (Top right) HopX+/TPH1+ EC cell (arrow) at position 4. (Bottom left) Sox9+/TPH1+ EC cell (arrow) at position 4. (Bottom center) Ngn3+ cell with low TPH1+ expression (immature EC cell, arrow) at position 4 in the upper right crypt. Ngn3-/TPH1+ EC cell (mature EC, short arrow) in the left crypt. (Bottom right) Two NeuroD1+/TPH1+ EC cells at positions 4 and 6. EC cells were identified by the expression of TPH1 (fast red fluorescence, red) or (fast blue fluorescence, green). Expression of Bmi1, HopX and Sox9 were detected as fast red fluorescence (red). Lgr5 , Ngn3 and NeuroD1 were detected as fast blue fluorescence (green). Representative RNA-ISH images for Bmi1 and HopX were obtained from patient F1 and the other images from patient F2. P, Paneth cell. Scale bars, 10 μm (B) Graphical representation of the percent of EC cells (TPH1+) expressing the indicated genes in relation to their position within the crypt (mean+SE, n=2-4). The data were obtained from the normal ileal mucosa of the patients, C1(control without SI-NET), F1, F2 and F4. An average of 526 TPH1+ cells per patient and 105 TPH1+ cells per gene were examined.
