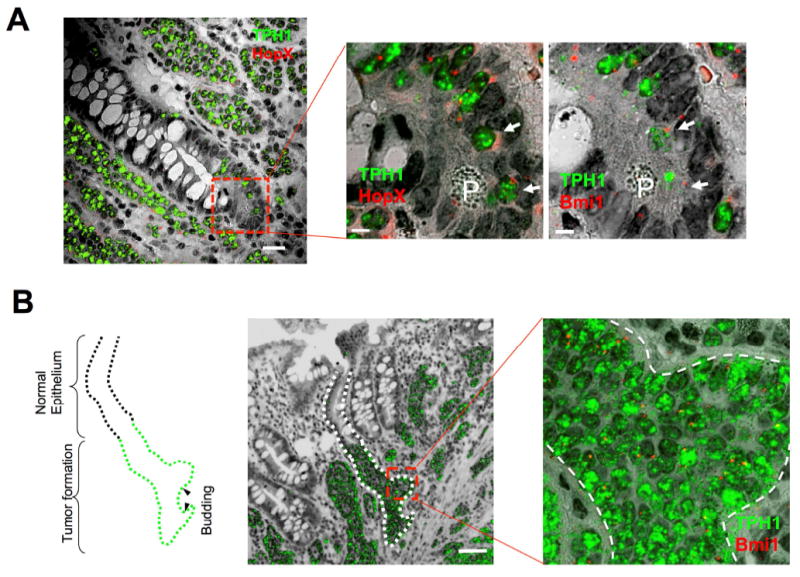
Figure 4.

Expression of both reserve stem cell marker genes and differentiation genes in early tumorigenesis of SI-NETs. (A) Expression of HopX and Bmi1 in an early intraepithelial SI-NET formation, ACEC, in an FFPE section from an ileal tumor in a patient with familial SI-NET (F2). The merged image of HopX (fast red fluorescence, red) and TPH1 (fast blue fluorescence, green) with transmitted light image shows expression of TPH1 in multiple extraepithelial tumor nests and an early stage of ACEC (dashed square inset). (A, center) Enlarged image of the square inset region in the figure A-left illustrating a portion of abnormal cluster of doubly positive TPH1+/HopX+ cells including cells at positions 4 and 6 (white arrows). P indicates Paneth cell. (A, right) Enlarged image of a portion of abnormal cluster of Bmi1 (red) and TPH1 (green) expressing cells including cells at positions 4 and 6 (white arrows) obtained from a different RNA-ISH of the next serial section and same square inset shown in the A-center. P indicates Paneth cell. Scale bars in A-left, 20 μm; in A-center and -right, 5 μm. (B) Images of SI crypt budding of tumor cells from an intraepithelial SI-NET advanced ACEC, in the ileal epithelium. A merged image of a FFPE section from a SI-NET RNA-ISH of TPH1 expressing tumor cells (green) with the transmitted light image shows TPH1 positive SI-NET formation in the epithelium (outlined by dotted line). The outlined drawing (left) of this ACEC illustrates putative areas of nascent budding. Closer evaluation of budding areas designated by red square correspond to the enlarged image (right) of RNA-ISH of Bmi1 (red) and TPH1 (green) expression merged with transmitted light images. The dashed line in the illustration indicates the border of normal epithelium and tumor cell-filled epithelium. Arrowheads in the illustration mark putative areas of early budding. Scale bar, 50 μm.
