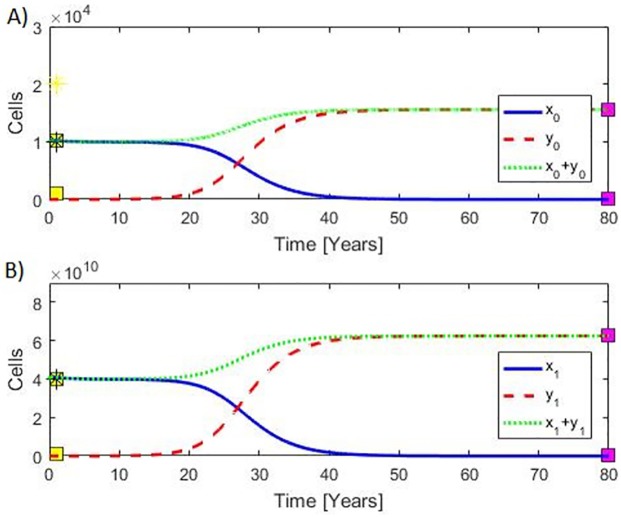
Fig 2. Model calibration.
A) Plateaus to the left show the amount of hematopoietic stem cells x0 (upper plateau) and that for MPN stem cells y0 (lower plateau) whereas the plateaus to the right show the amount of hematopoietic stem cells x0(lower plateau) and MPN mature cells y0 (upper plateau). B) Plateaus to the left show the amount of hematopoietic mature cells x1 (upper plateau) and that for MPN mature cells y1 (lower plateau) whereas the plateaus to the right show the amount of hematopoietic mature cells x1 (lower plateau) and MPN mature cells y1 (upper plateau). The yellow and purple boxes show our data used for calibrating (and validating) the model with further details in S1 Appendix. Yellow boxes show our “no MPN cancer values”, and purple boxes show our “full blown” MPN values in the advanced myelofibrosis stage. Yellow position marker shows the number of hematopoietic stem cells as used by Dingli & Michor [92], and black position markers show the number of cells as used by Gentry et al. [86].

