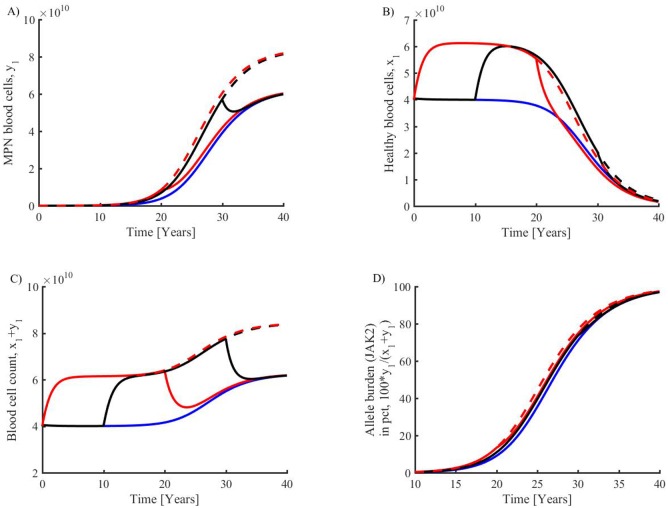
Fig 5. Investigation of increased inflammatory load at various onsets and durations.
Blue curve is default parameters corresponding to Fig 3, red dotted is a doubling of inflammatory load, full red curve is a doubling of inflammatory load in year 0–20, then back to default level, black dotted curve is inflammatory doubling from year 10, the full black is inflammatory doubling year 10–30. Upper: Increasing inflammatory load has a boosting effect on MPN MC (A) as well as on HMC (B). Lower: Displaying the results in terms of the clinically available quantity, total blood cell count, also shows a boosted effect with increasing inflammatory load (C). The allele burden of JAK2 mutated blood cells similarly shows that increased inflammation increases disease development (D). There is a clear effect of MPN promotion with increasing inflammatory load, earlier onset, and exposure time. Lowering inflammatory load makes disease progression less rapid. Maintaining a doubling (red dotted curve) shifts the allele burden curve to the left by two years. Shortening the exposure time of inflammatory load weakens the disease progression. The inflammation has a fast impact on the total number of blood cells, which typically changes by 25% within the first year after doubling or reducing the inflammatory load by 50%.

