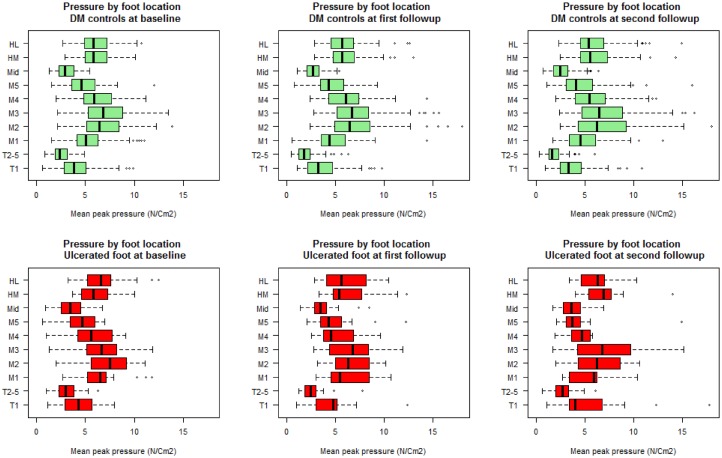
Fig 1. Site-specific mean peak pressures over time in participants with DFUs and participants without DFUs.
Figure indicates the mean peak pressure at ten plantar sites in cases (red) and diabetes controls (DM controls) (green) at each visit. The x-axis has been scaled to allow for better data visualisation. All values are in N/Cm2 and are reported for 10 plantar foot sites. T1 = hallux (big-toe), T2-5 = toes two to five, M1 = metatarsal one, M2 = metatarsal two, M3 = metatarsal three, M4 = metatarsal four, M5 = metatarsal five, Mid = mid-foot, HM = medial heel and HL = lateral heel.

