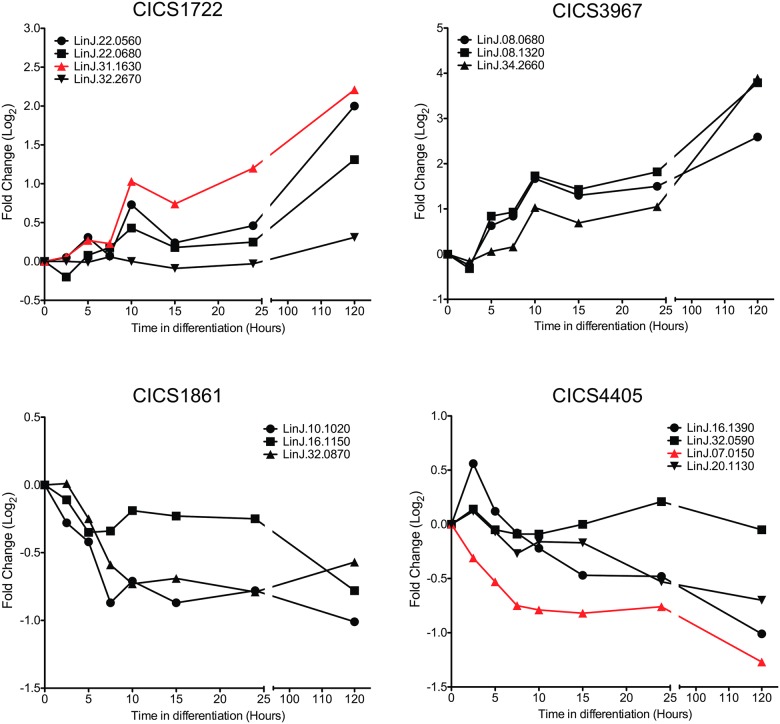
Fig 1. Transcript modulation pattern during differentiation.
Comparison of the transcript levels of genes bearing the same CICS in their UTRs using microarray data [21]. Lahav et. al. measured transcript levels at eight time points (0, 2.5, 5, 7.5, 10, 15, 24 and 120 hours) of differentiation from promastigote to amastigote stages by microarray [21]. We collated four groups of co-regulated genes sharing the same CICS. In each group, the expression change of the gene selected for replacement by the NEO marker is depicted in red. The time points 0 hours and 120 hours are respectively equivalent to the metacyclic promastigote and amastigote stages outlined in S1 Fig.

