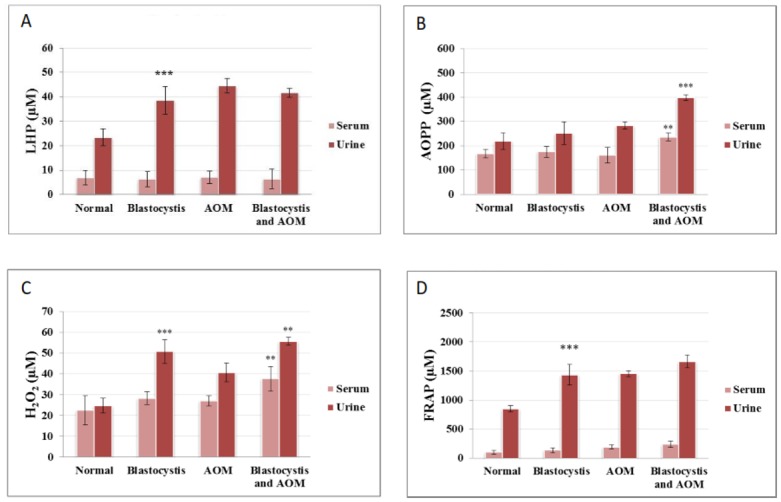
Fig 12. Comparison of (A) LHP, (B) AOPP, (C) H2O2 and (D) FRAP levels in blood and urine samples of normal, Blastocystis infected, AOM-treated controls and rats treated with AOM + Blastocystis infection.

Groups of six rats were inoculated with Blastocystis and injected with AOM simultaneously (co-infection). Data are given as mean SEM of six animals/group by Student’s t-test (SPSS version 13). ***P<0.001 is the comparison between columns of Blastocystis and normal as well as Blastocystis + AOM and AOM.
