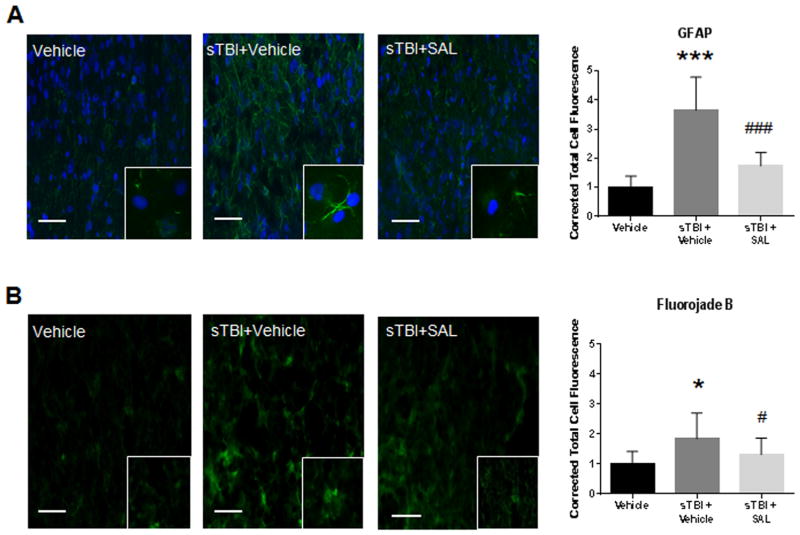
Fig. 5.
SAL attenuated markers of neurodegeneration after single blast. We observed a significant increase in GFAP (green) fluorescence at 72 h post-sTBI (***P<0.001 vs Vehicle); SAL significantly reduced GFAP fluorescence (###P<0.001) (n=4). GFAP images include nuclear counterstain DAPI (blue) (A). We observed a significant increase in FJB (green) fluorescence at 72 h post-sTBI (*P<0.05 vs Vehicle); SAL significantly reduced FJB fluorescence (#P<0.05) (B). One-way ANOVA, Newman-Keul’s post hoc. Mean±S.E.M. n=4. Images are from the lateral orbitofrontal cortex. Images are displayed at 20 ×; insets at 63 ×. (Scale bars =30 μm).

