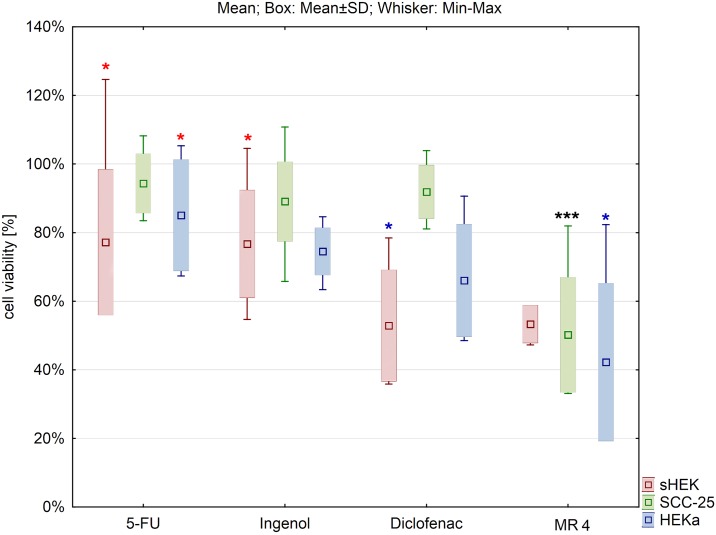
Fig 8. Comparison of the effect of selected compounds on cell viability of three cell lines in the middle concentrations (for MR4 0.5% and 50 μM for the commercial compounds).
The results were expressed as a percentage of the viability of treated cells to untreated ones. The results are presented as box plots. Asterisks indicate the significance of difference. However one has to notice that due to the testing of differences between all variants, different star colors were used. The variants differ significantly only if the asterisk color is various. Black asterisk means that selected variant differs with all the others. In contrast, the same color indicates that difference is statistically irrelevant. Moreover, number of asterisks (*; ** or ***) refers to p < 0.05; p < 0.01 and p < 0.005, respectively.

