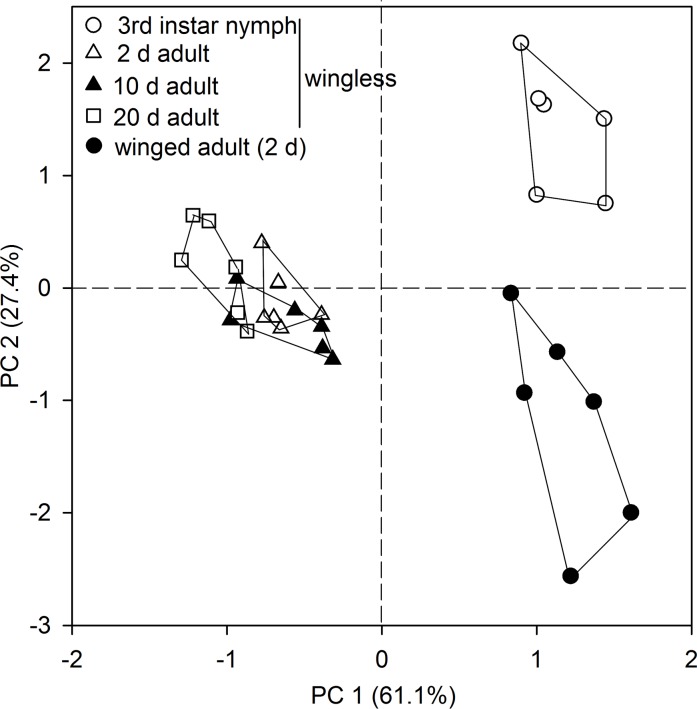
Fig 3. Principal components analysis (PCA) of CHC profiles of the 3rd instar nymphs, wingless and winged adults of A. pisum.
The GNY morph was used for direct SPME sampling with 7 μm PDMS fiber. Shown are score plots of PC 1 versus 2, with the percentage of total variance explained by each axis given in parentheses. Each symbol represents an aphid individual. Data points for each group are enclosed within a line.

