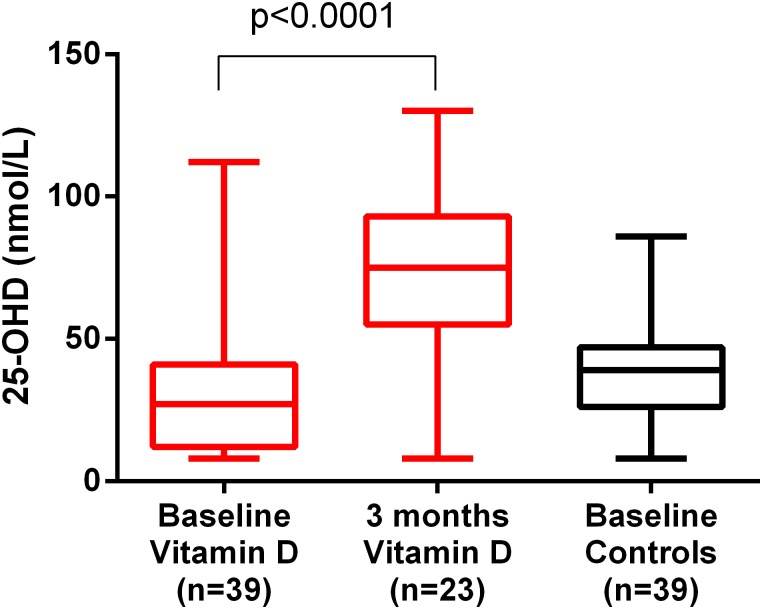
Fig 3. 25-hydroxyvitamin D (25-OHD) levels in the vitamin D (n = 39 and n = 23) and control group (n = 39).
There was a significant increase of 25-OHD levels in the vitamin D group compared to baseline; statistical analysis was performed by using a paired t-test (p<0.0001). There was no statistically significant difference in baseline values between the vitamin D and control group. There were no follow-up measurements performed in the control group. The lines show median value, the boxes 25–75 percentile and whiskers show minimum and maximum.

