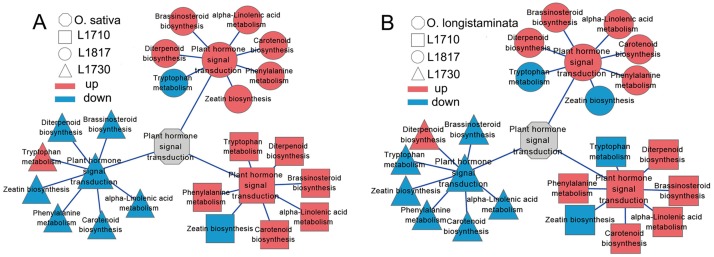
Fig 5. Pathway of plant hormone signal transduction analysis in the three progeny lines.
The up/down regulation of plant hormone signal transduction pathway in the progeny/O. sativa comparison groups (A) and the progeny/O. longistaminata comparison groups (B). Red standing for up-regulated and blue standing for down-regulated.

