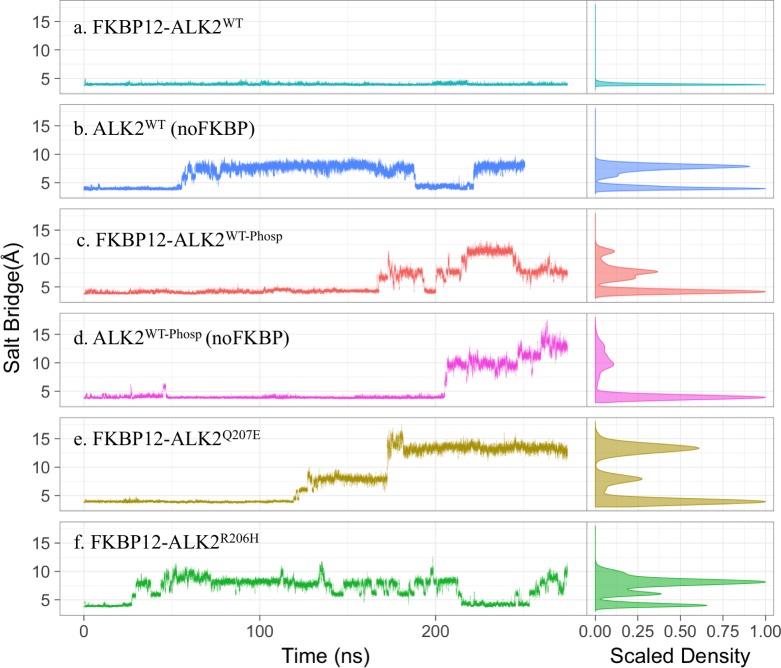
Fig 2. Salt bridge distance between R375(Cζ) and D354 (Cγ) in six simulated systems: FKBP12-ALK2WT; ALK2WT; FKBP12-ALK2WT-Phosp; ALK2WT-Phosp; FKBP12-ALKQ207E; and FKBP12-ALK2R206H.
The right panels are the distribution of the distances over the whole trajectories. R375(Cζ)-D354 (Cγ) distance below 5 Å represents salt bridge forming.

