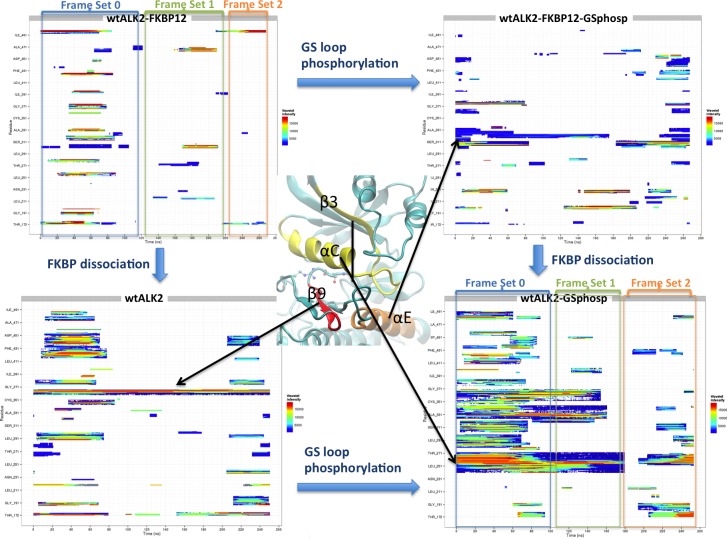
Fig 4. WAFEX (clustered wavelet transform) analysis diagram for trajectories from four systems: FKBP12-ALK2WT, ALK2WT, FKBP12-ALK2WT-Phosp, and ALK2WT-Phosp.
The simulation time is shown on x-axis and residue numbers are shown on y-axis. Three-dimensional representation of regions of interest is shown in the middle to indicate corresponding regions in the WAFEX plots. Color code indicates the wavelet intensity, with red representing the most intensive and blue the least intensive. Frame sets 0 to 2 were used to guide subsequent principal component analysis.

