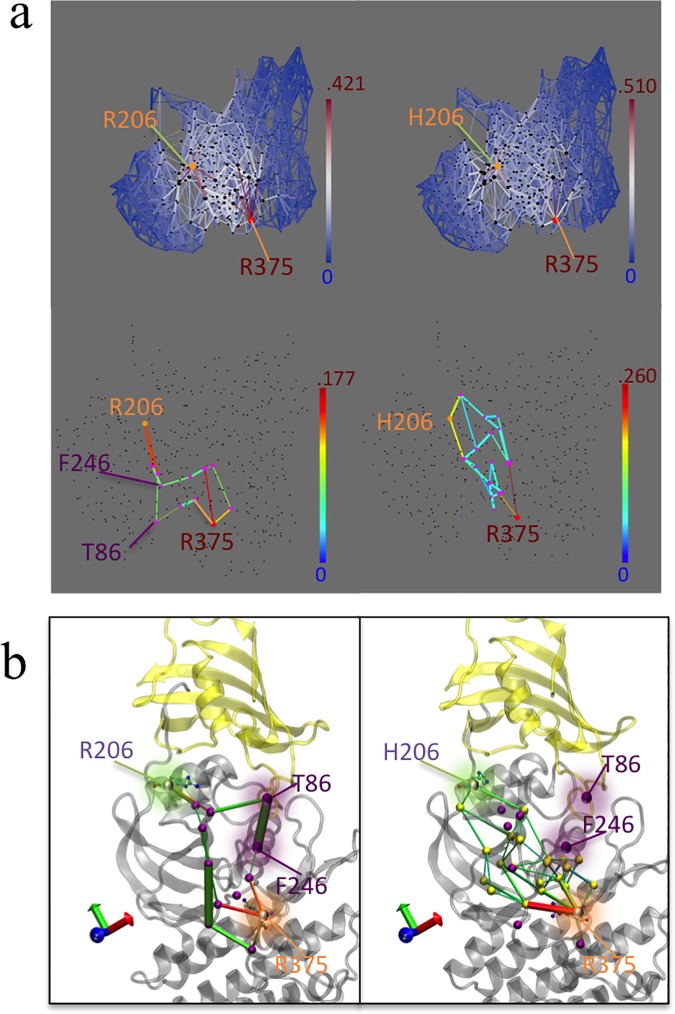
Fig 7. Network analysis shows the communication between R/H206 and R375 in FKBP12-ALKWT (left) and FKBP12-ALKR206H (right).
(a). 2D depiction of atomic motion transmission networks from residue 206 to residue R375. Edge color depicts current flow-betweenness scores, representing the relative importance of each contact pair with respect to transmission of motion between the residue 206 and R375. Line thickness represents atomic fluctuation correlation between nodes (Cα of residues) Top: full transmission network. Bottom: Sub-networks corresponding to optimum flow-betweenness path plus additional edges of suboptimal paths which exceeded optimal path length by no more than 20%. (b) 3D depiction of high transmission networks between residue 206 and R375. Nodes participating in sub-network, along with the relevant salt bridge lock residue D354 are marked with purple spheres. Nodes present in R206H mutant and not in wild type are marked with yellow spheres in the R206H sub-panel.

