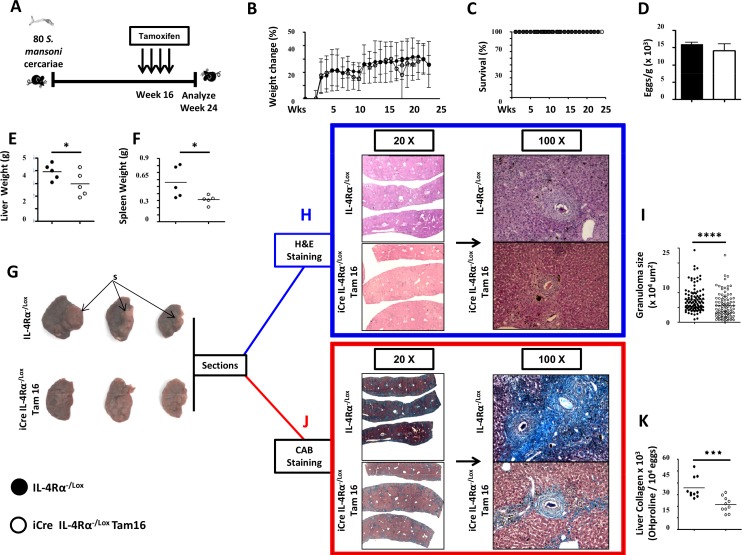
Fig 6. Histopathological profile of S. mansoni-infected mice after knocking down IL-4Rα 16 weeks post-infection.
A. Experimental design. B. Body weight change over time following S. mansoni infection. C. Survival curve over 24 weeks following S. mansoni infection and IL-4Rα knockdown 16 weeks post-infection. D. Liver egg burden. E. Liver weights. F. Spleen weights. G. Representative photographs of liver lobes from mice infected for 24 weeks with S. mansoni with and without IL-Rα signaling interruption at week 16. Note the formed acellular scar-like structure (S) in the livers of control mice. H. Formalin-fixed sections of the liver lobes were performed and stained with Hematoxylin/Eosin (H&E). I. Area size of egg-surrounding granuloma computed from H&E stained sections. J. Formalin-fixed sections of the liver lobes were stained with CAB for collagen detection (in Blue). (K) Hydroxyproline content measured by colorimetry is displayed as a measure of tissue collagen content. Each experiment was conducted at least twice with 5–10 mice per group. Data are expressed as mean ± SD; NS = p > 0.05; * = p < 0.05; ** = p < 0.01; *** =, p < 0.001; **** = p < 0.0001.

