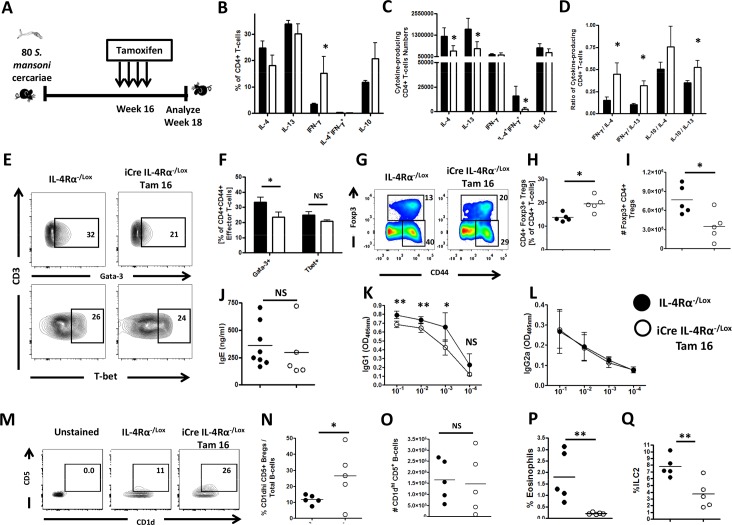
Fig 7. Immunological polarization of S. mansoni-infected mice after knocking down IL-4Rα 16 weeks post-infection.
A. Experimental design for Immunological assays. Percentages (B), numbers (C) and ratios (D) of cytokine-producing CD4+ T cells after stimulation with PMA/Ionomycin/Monensin cocktail. E. Percentages of various transcription factor-expressing CD4+ T cells (ex-vivo) summarized in F. G. Representative plot of MLN Foxp3+CD4+ regulatory T cells (gated on CD3+CD4+ Lymphocytes). Summaries of frequencies (H) and total cell numbers (I) of MLN Foxp3+ Tregs. J. Total seric IgE in S. mansoni-infected mice. SEA-specific seric IgG1 (K) and IgG2a (L) isotype antibodies. M. Representative plot of MLN CD1dhiCD5+ regulatory B cells (gated on CD19+ Lymphocytes). Summaries of frequencies (N) and total cell numbers (O) of CD1dhiCD5+ regulatory B cells (gated on CD19+ Lymphocytes) per MLN. P. Frequencies of SSChi SiglecF+ eosinophils within total MLN cells. Q. Frequencies of MLN Lin- T1/ST2+ ICOS+ (ILC2) cells. Each experiment was conducted at least twice with 5–10 mice per group. Data are expressed as mean ± SD; NS = p > 0.05; * = p < 0.05; ** = p < 0.01; *** =, p < 0.001; **** = p < 0.0001.

